Unpaving Paradise: Making Room for Up to 20 Million Homes on Parking Near Transit
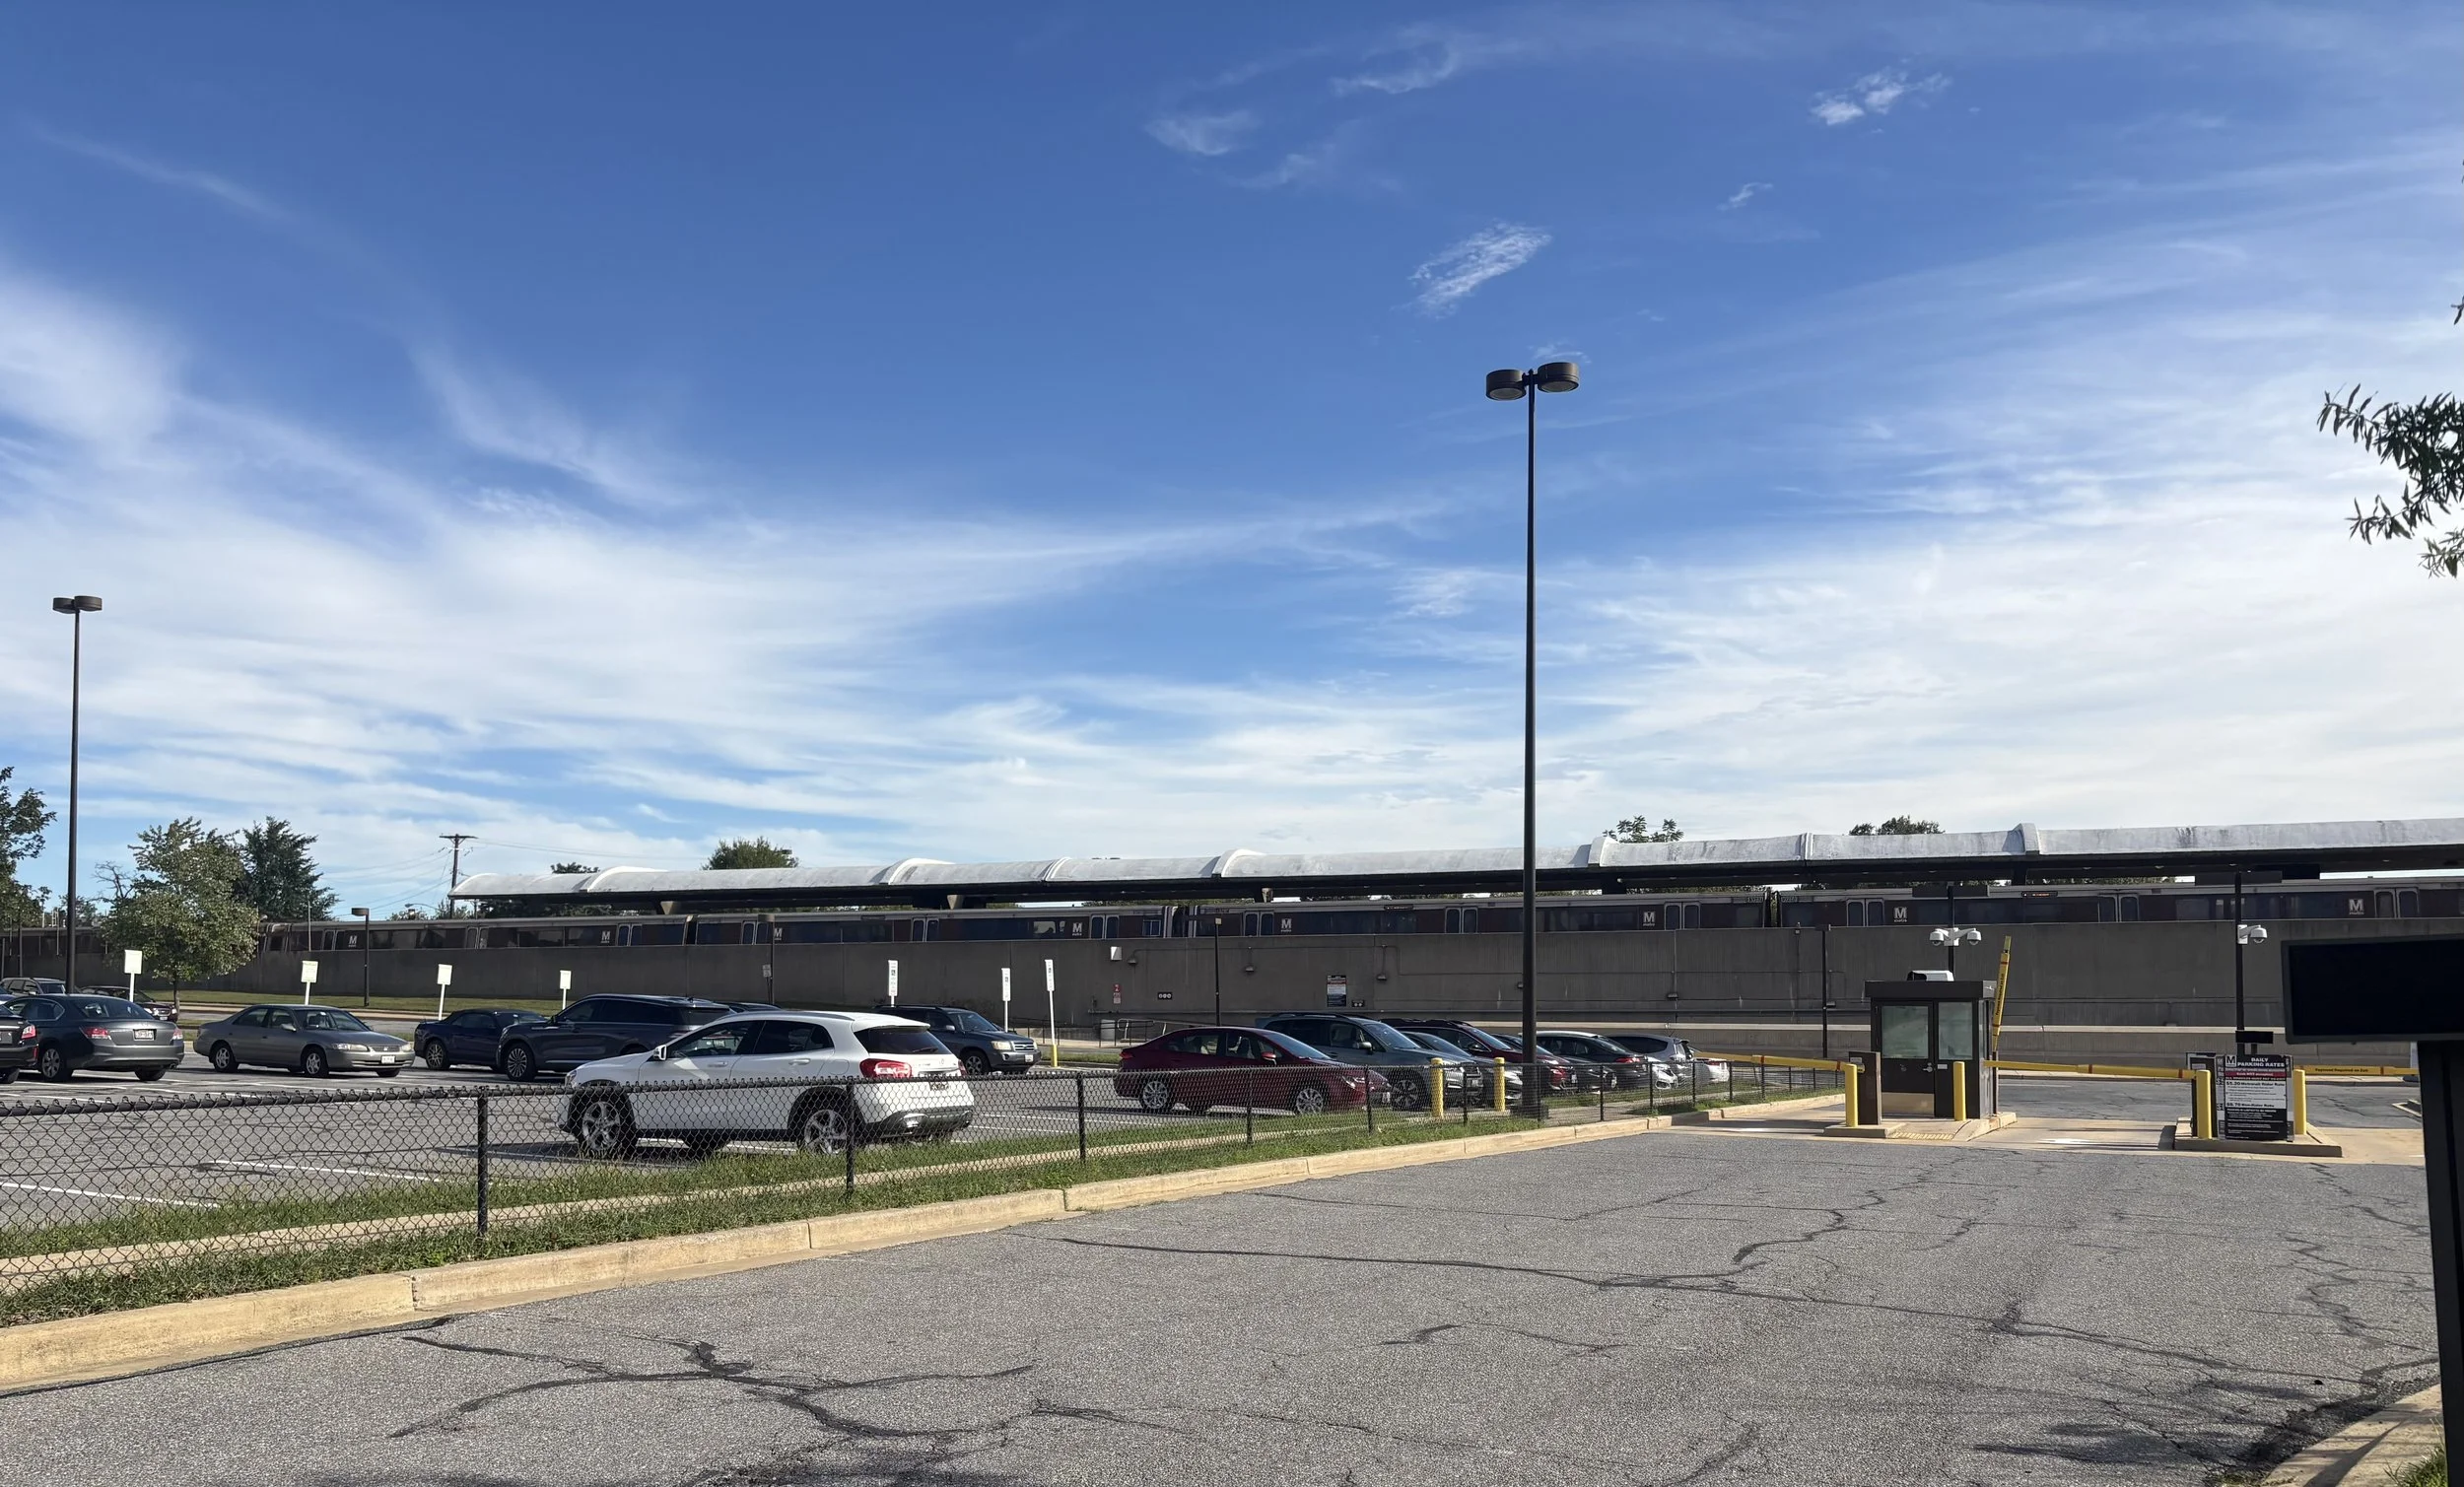
WMATA park-and-ride lots like this one next to the Twinbrook Station were recently exempted from restrictions on building heights, uses, and setbacks. WMATA plans to solicit development proposals this fall. Image by the author.
We've spent billions of dollars building transit, then surrounded the stations with parking. Within half a mile of the nation's 5,115 rail, bus rapid transit, and ferry stations, there are almost 2 billion square feet of parking lots and garages, and 57% of those station areas have more parking than buildings. Replace that parking with apartments no taller than their neighbors, and we'd have room for seven to twenty million new homes.
This idea isn’t mine alone In his 2023 New York Times Opinion Piece, “How to Make Room for One Million New Yorkers” Architect Vishaan Chakrabarti offers a way to add 500,000 new housing units across the city’s five boroughs “without radically changing the character of the city’s neighborhoods or altering its historic districts.” His firm, Practice for Architecture and Urbanism identified areas within 1/2 mile of the city’s transit stations and ferry terminals, excluding areas that might be prone to flooding. He then identified underutilized land (i.e. surface parking, single story buildings, or vacant land) and calculated how many housing units could be added without building any higher than nearby structures.
As the song goes, “if you can make it here, you can make it anywhere.” If this analytical approach to addressing our housing shortage makes sense in New York City, why not apply it to the rest of the country?
I’ve been working to do just that via computer coding and data storytelling over the past eighteen months. In the spring of 2025, student intern Kaisar Hossain and I created a digital surveyor that calculated the number of buildings, building footprint, and building heights (where available) around every transit rail, bus rapid transit, and ferry station in the United States, 5,115 stations total. Our publication, “The Eight Types: A National Typology for Transit-Oriented Housing” presented a typology of eight urban forms around stations, from sparse exurban villages to dense downtown development, with context-sensitive strategies to bring additional homes to each type.
Over the summer, I filled in gaps on urban form around stations by fusing publicly available data from OpenStreetMap with data from the Global Building Atlas created by the Technical University of Munich. My subsequent post, “Bring me Your Higher Love” describes this process and explains why I am now able to estimate the height of the tallest building around every transit station, not just a subset of stations.
Armed with higher quality data, this post imagines a national number of homes that could be built near transit stations on relatively large parking lots or garages without exceeding nearby height constraints.
Most estimates put the national housing shortage between 2 and 5 million homes, and even the highest put it around 10 to 20 million. By my estimate, we have room to replace almost 2 billion square feet of parking with seven to twenty million new homes located within ½ mile of transit stations across the United States. Parking-to-housing estimates for each of the transit stations in the Atlas are available here and aggregated data of parking availability and housing potential by transit line, system, city, county, and state can be found in the data repository under “Housing Estimates.”
I’m not suggesting that every large parking lot will or even should be converted to housing. My point is that the land exists to close the shortage several times over. The barriers are zoning, financing, and political will, not lack of space.
An Abundance of Parking
In cities across the United States, we have invested billions of dollars in high-capacity public transportation and surrounded the stations with acres of parking. We extol the benefits of transit, on the one hand, and prioritize car travel and car storage on prime real estate next to the stations on the other.
How much parking have we built in the United States of America? Henry Grabar’s excellent treatise Paved Paradise: How Parking Explains the World (published in 2023) put the figure at a little under a billion spaces which, at around 330 square feet per space, is about twice the size of the state of Connecticut. Parking guru Donald Shoup estimated that America has 2.5 to seven spaces for every car in 2023. The United States Geological Survey in 2019 published that 5.5 percent of developed land in the lower 48 United States is a surface parking lot. There is no single agency or government database responsible for tracking parking spaces.
My research estimated the amount of surface parking and parking garages within ½ mile of the nation’s 5115 rail, bus rapid transit, and ferry stations by querying OpenStreetMap data for land tagged as parking lots or garages. In order to focus on parking with the greatest potential for development, I counted only lots and garages of 2,000 square meters (21,528 square feet or almost half an acre) or greater. This threshold is around the point where a mid-rise apartment building becomes feasible and can include enough apartments to absorb some of the costs, It also excludes driveways, small accessory lots in front of or behind stores, or slivers of pavement that cannot be easily developed (although infill development may still be possible on smaller lots). To avoid overcounting, I pro-rated parking area where stations are located within ½ mile of one another. For example, the total parking within ½ mile of a station that was located near a second station was divided by 2. If three stations were located within ½ mile of one another, the total parking around each station was divided by 3.
Under these assumptions, I’ve identified 26,817 large surface lots and 1,707 garages totaling almost 2 billion (1,988,324,232) square feet of developable parking within ½ mile of transit stations.
Surface parking and garages are not distributed uniformly around all of the station. Most of the parking is clustered around specific places and neighborhood types.
Regional Destinations: Stadiums, Malls, Airports
Not surprisingly, sports stadium stations have some of the most surrounding parking. These places include the NRG Station in Philadelphia (surrounded by 5.8 million square feet of parking), the Oakland Coliseum Station (4.4 million square feet of parking), and St. Louis’s Busch Stadium Station (4.1 million square feet of parking).
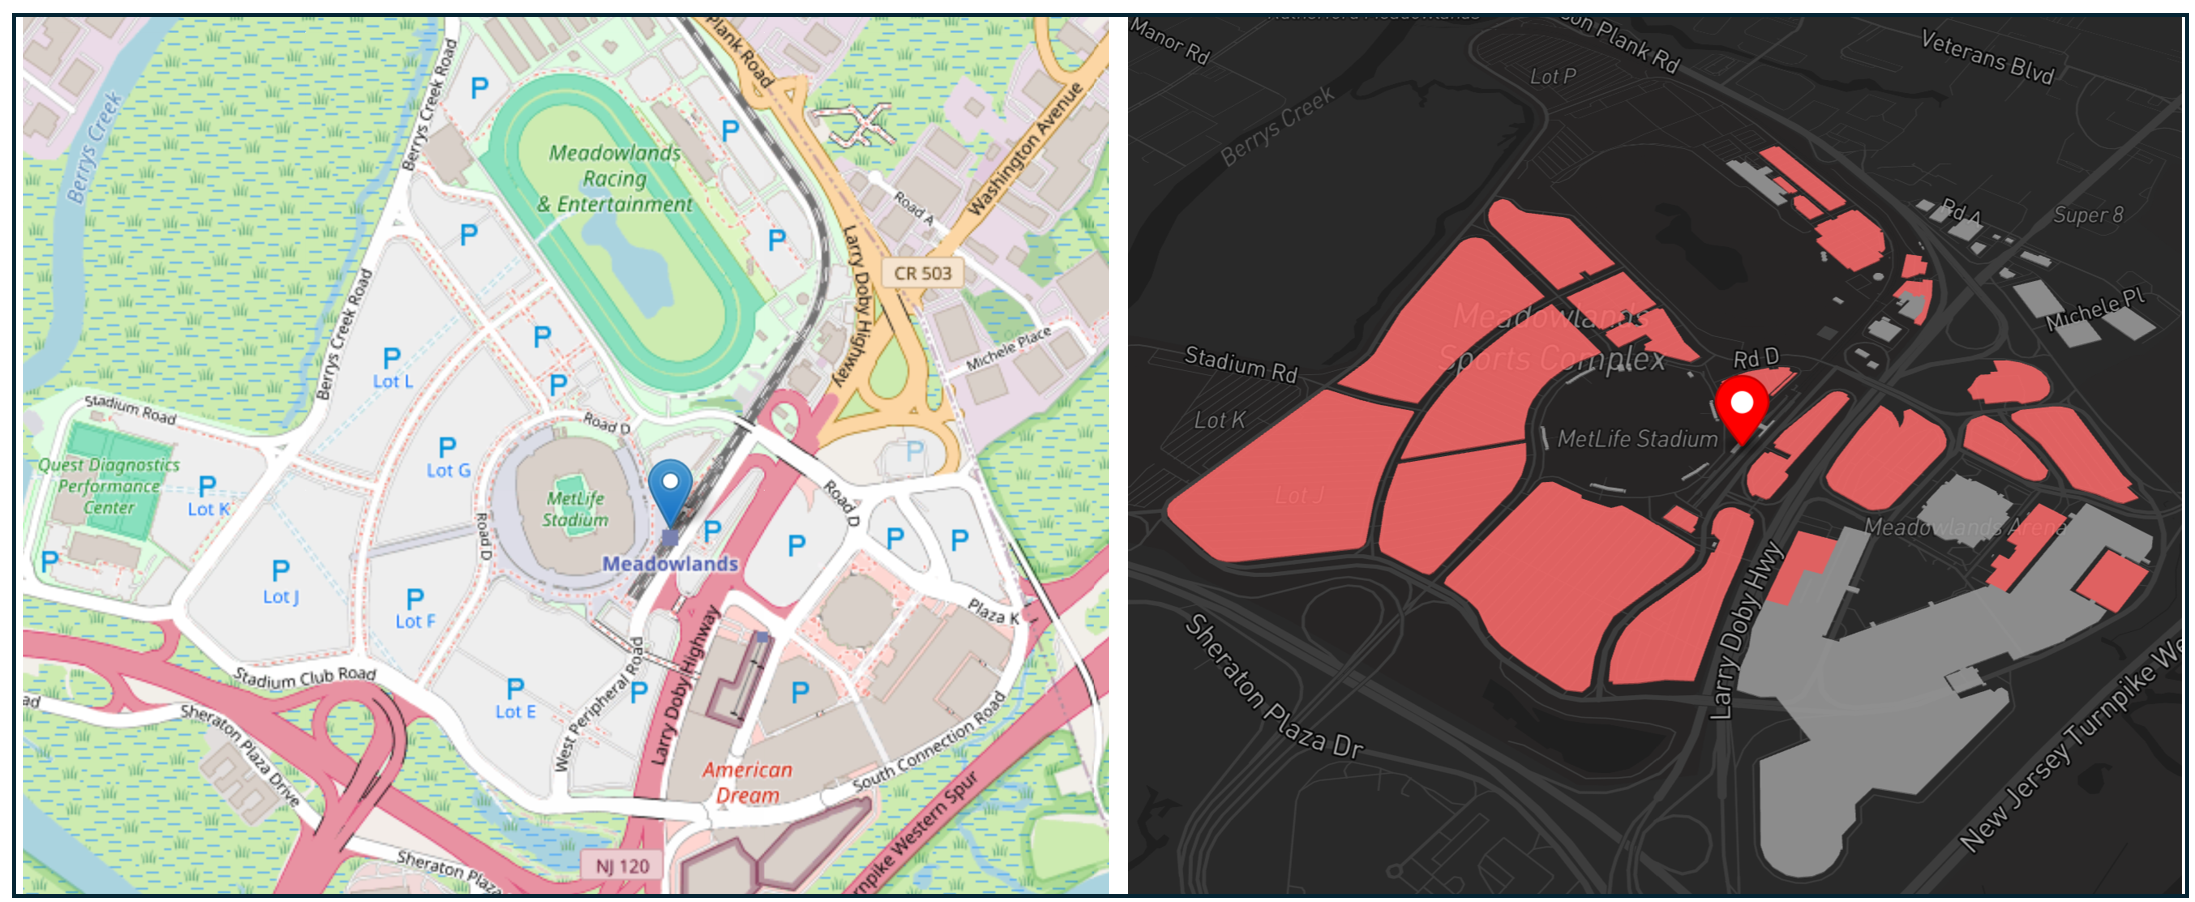
The New Jersey Transit (NJT) Meadowlands Station area includes 7.2 million square feet of parking space (#3 out of 5115 stations).
My previous blog post on sports infrastructure, “The Long Game: What the World Cup Says About American Cities” describe how many stadiums, once located downtown, moved to the exurbs to serve a regional audience who would drive to events. A transit connection, if one was ever built, was added later. Stadium parking lot tailgates can be great fun on game days but the lots sit empty for the vast majority of the time.
It doesn’t have to be this way. Cities around the country have re-purposed former stadium sites into mixed development or are integrating housing and retail into stadium sites that once served only cars. In Atlanta, after the Braves left Turner Field for a new stadium in Cobb County, the field became Georgia State's football stadium, and the lots around it became housing. Since 2019, more than 1,000 new apartments have been built on former Turner Field parking lots and other underused land. In 2024 the Denver City Council unanimously rezoned about 70 acres around Ball Arena (55 acres of which consisted of parking), to encourage 6,000 apartments or condos, with 1,080 designated affordable. In Washington DC, planners are reimagining a stadium neighborhood for the Commanders that replaces surface parking with housing and retail, though some activists would prefer no stadium at all and better transit connections to the site.
Shopping malls adjacent to transit stations also have some of the most parking of any station area in the country. These places include the Mall of America Station in Minneapolis, MN (4.1 million square feet of parking) and the Great Mall Station in Milpitas, CA (3.9 million square feet of parking)
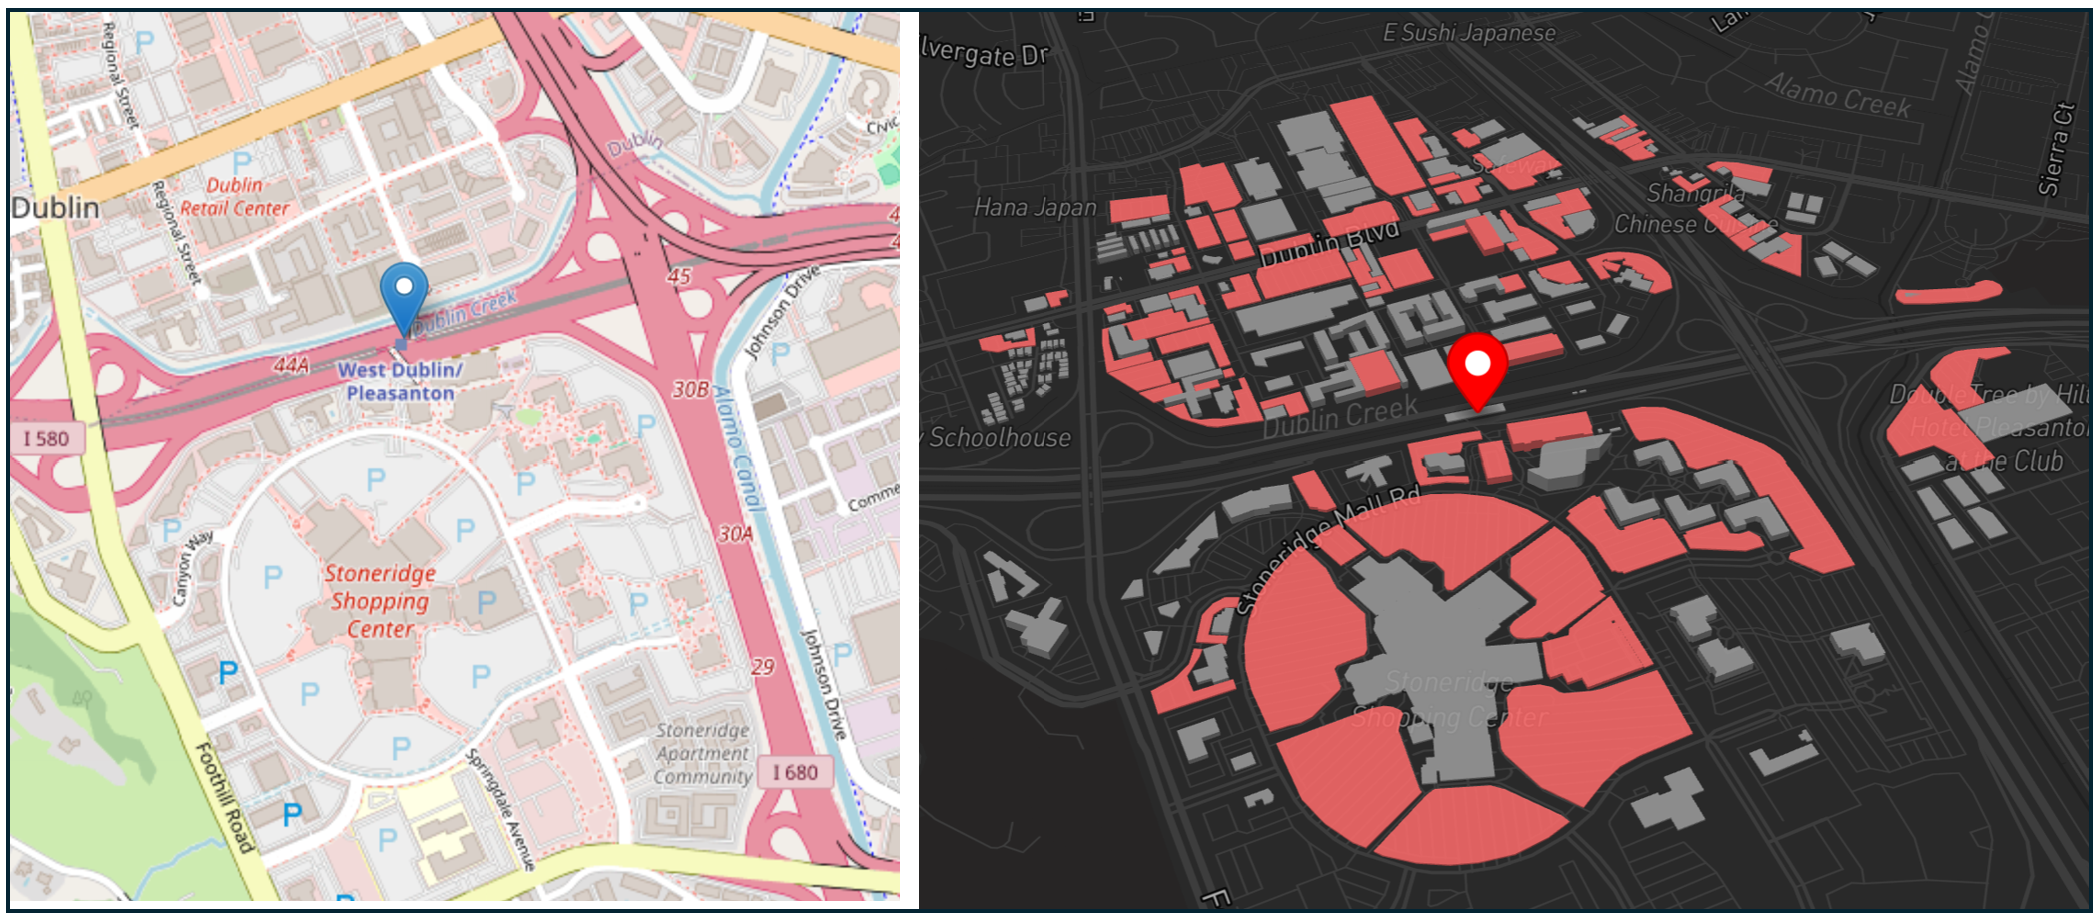
The Bay Area Rapid Transit (BART) West Dublin/Pleasanton area includes 5.3 million square feet of parking space (#12 out of 5115 stations).
Historically, many parking lots have been sized to fit enough cars for the “20th busiest hour of the year” which is typically on a day leading up to Christmas. This means the lot is big enough about 99.4% of the time and for nearly all of those 3,000-plus hours, a large share of it sits empty, especially if some of the patrons are using a nearby transit line to get to and from the stores.
This is beginning to change in places like Seattle, where the Northgate Mall is being converted to a 55-acre mall into a mixed-use center with hotels, housing, offices, and the Seattle Kraken's headquarters and practice rink, which replaced several parking lots next to the station. In Tysons Corner, VA, developers converted acres of mall parking into a mixed-use center near a Silver Line station. Parking was consolidated and office and residential towers share about 1,700 spaces.
Airports are the third institutional station area with some of the largest lots and most parking spaces. However, unlike stadiums and malls, parking is priced and often one of the airport’s largest sources of revenue and many airports are adding garages instead of shedding them.
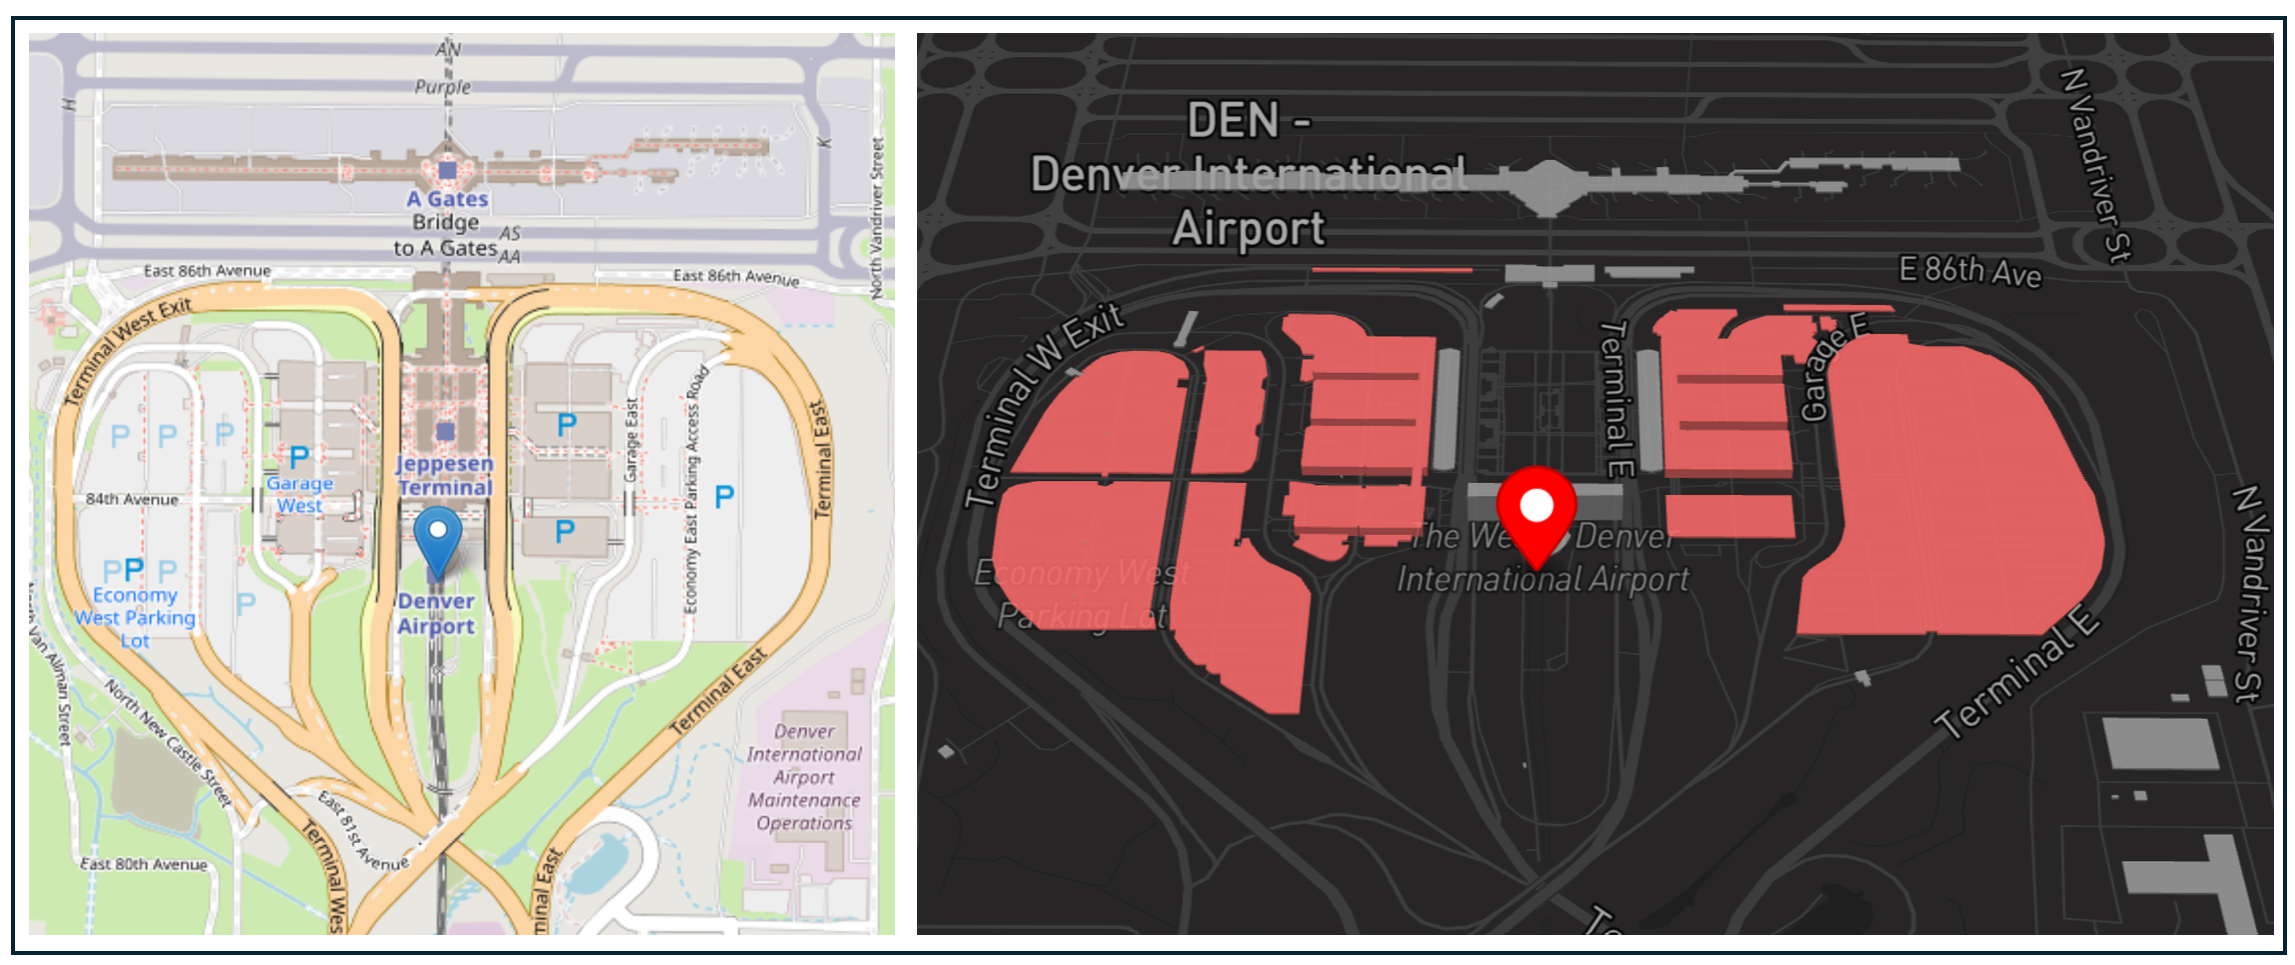
The Regional Transportation District (RTD) Denver Airport Station area includes 4.7 million square feet of parking space (#22 out of 5115 stations).
Housing near airports also faces constraints including height limits near runways and the noise associated with takeoffs and landings. However, economy and remote lots as well as private off-airport sites may be more feasible options.
Park-and-Ride Lots
Stadiums, malls, and airports were built for drivers first and transit riders second. Transit park and ride lots, on the other hand, were developed in order to increase ridership. These lots are typically located in low density areas, not walking distance of homes or businesses. They are supposed to encourage people to drive for part of their morning commute and take the train the rest of the way (and vice versa in the evening). While individual lots may not be particularly large, collectively they cover a lot of ground. Commuter rail stations make up about 26% of all transit stations and include 626 million square feet of parking, or around 32% of all station adjacent parking (though some of these lots may not be park-and-ride lots directly serving a station).
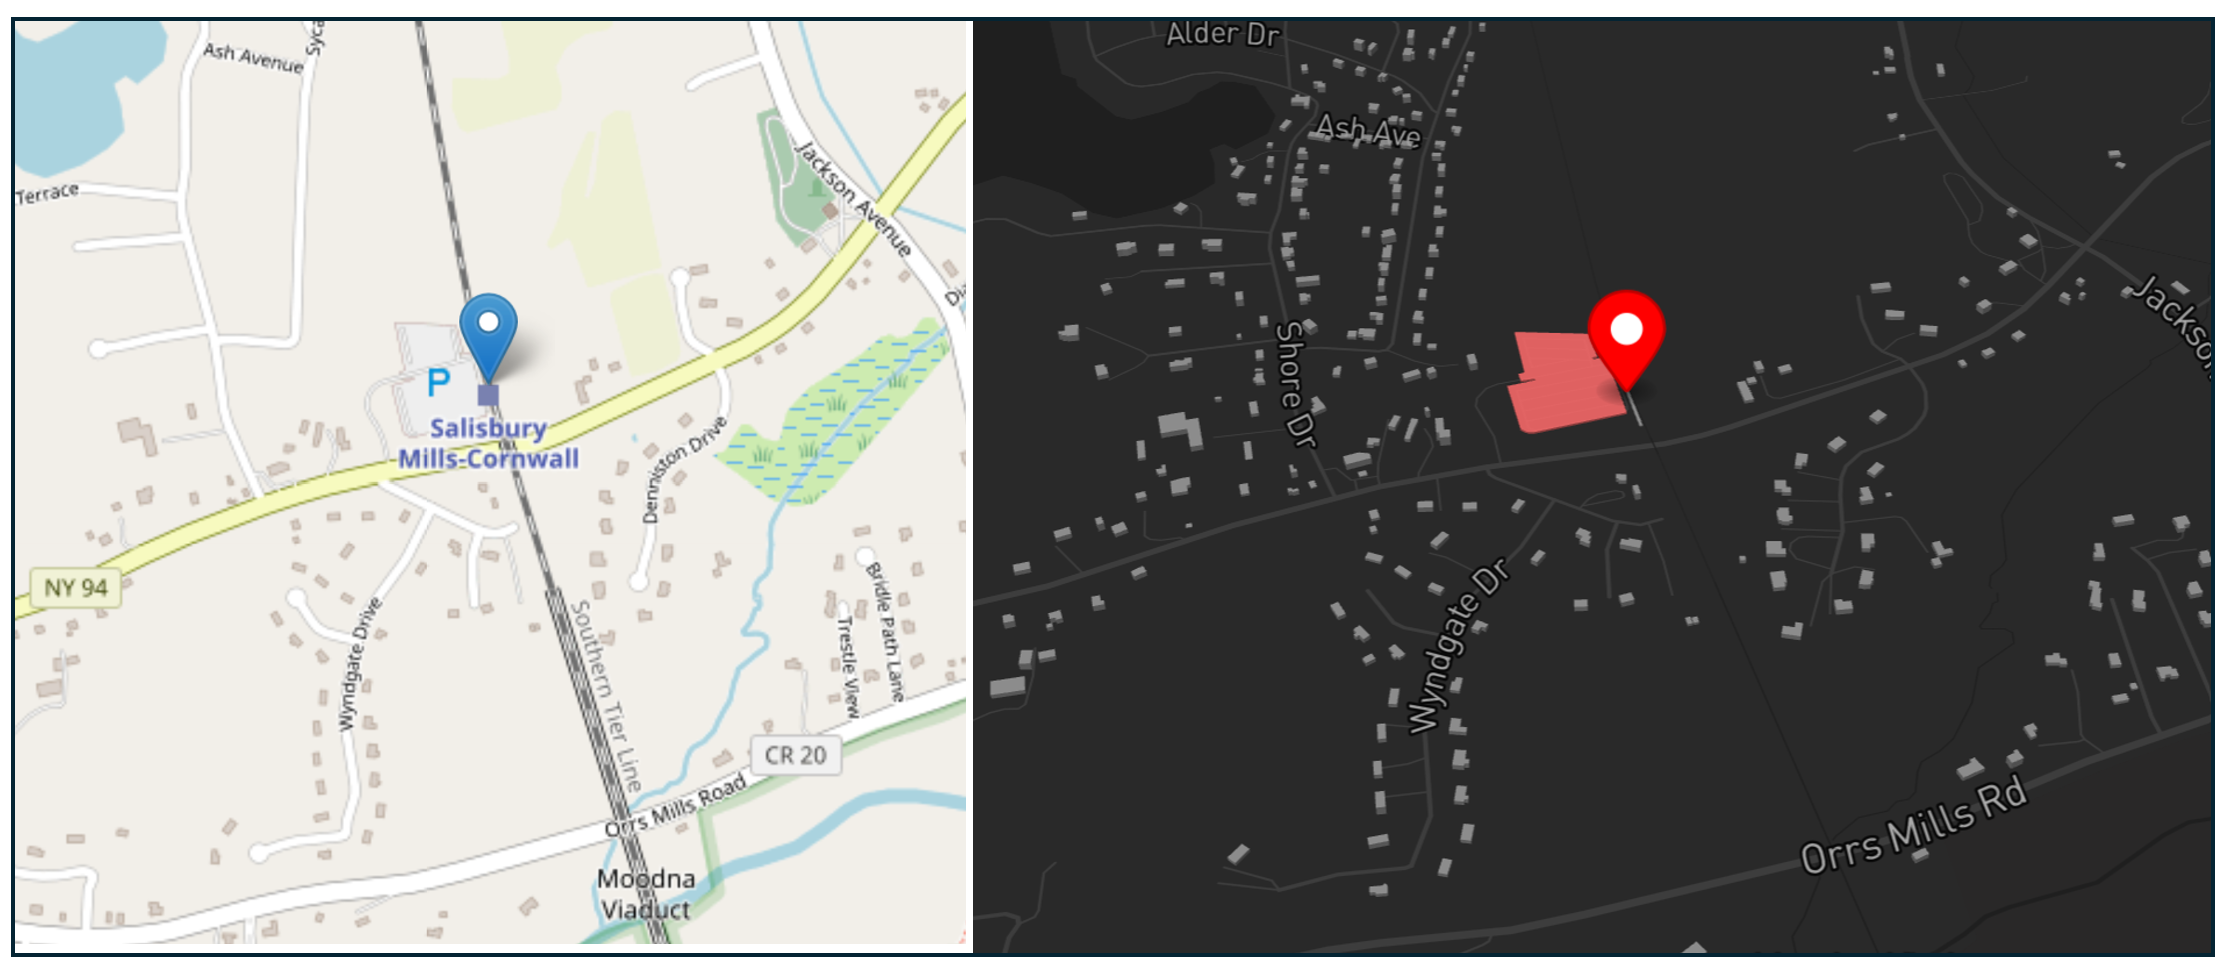
The Metro North Railroad (MNRR) Salisbury Mills-Cornwall Station area includes 199,000 square feet of parking space (#3549 out of 5115 stations).
A variation of the park-and-ride lot are large lots or garages located at a transit line’s terminus. These lots are designed to collect people living in outlying areas who are willing to drive to the end of a line and take transit the rest of the way to their destination.
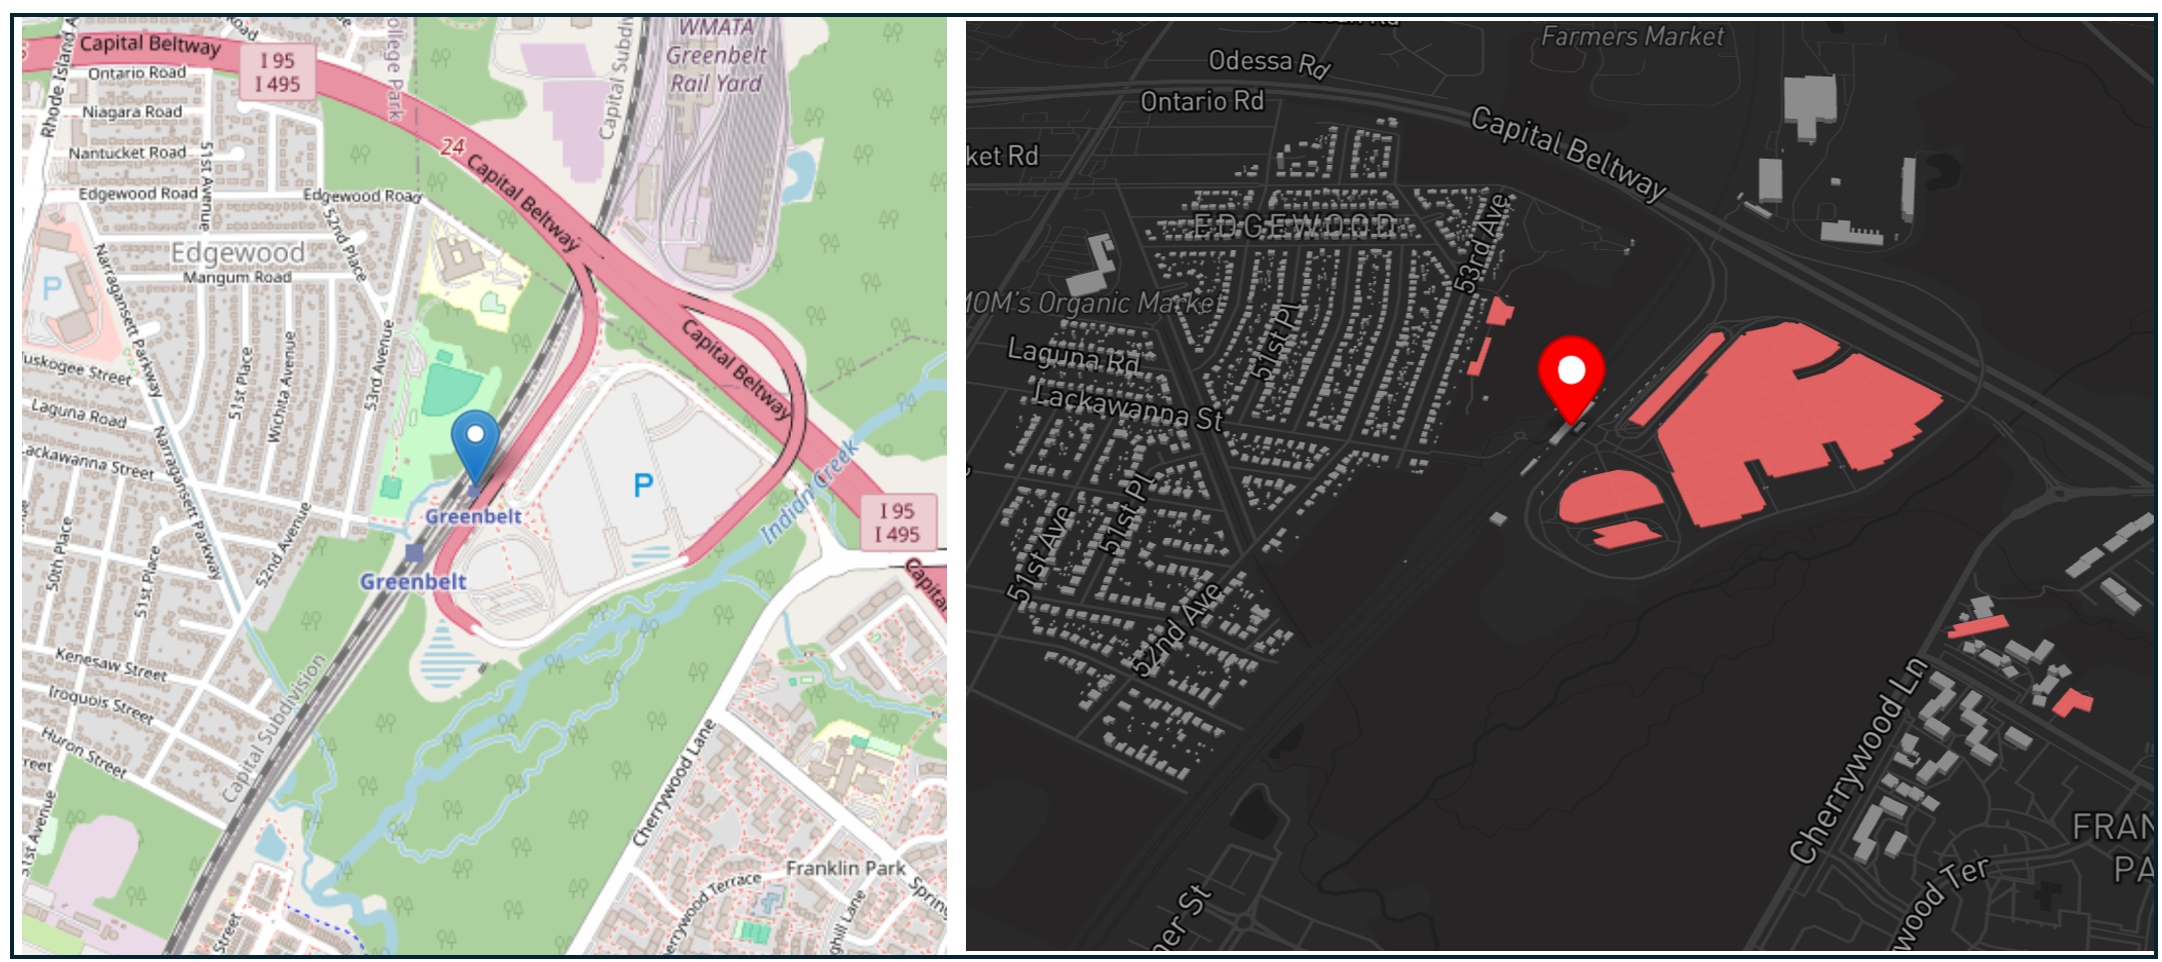
The Washington Metropolitan Area Transit Authority (WMATA) Greenbelt Station area includes 1.2 million square feet of parking space (#1259 out of 5115 stations).
Commuter rail parking and other park-and-rides are almost the opposite of airport parking in how they works financially and can be the most promising of all the station-area parking types for redevelopment. These lots rarely make money. An American Public Transportation Association (APTA) study found that some parking lot revenues don’t even cover the costs to collect the fees, let alone construct or maintain the lots. Even before the pandemic, many commuter lots weren't full. A Boston Region MPO inventory found 56% utilization for commuter rail lots, compared with 93% for express bus lots. WMATA's open data shows 2022–2025 parking use far below 2017–2020. Its large garages struggle to rise above 40% utilization.
Given these circumstances, many transit agencies have been working to convert park-and-ride lots to more productive uses. The Bay Area Rapid Transit District (BART), in San Francisco, the Regional Transportation District (RTD) in Denver, and King County Metro in Seattle all have comprehensive TOD plans, and a record of success, at repatriating park and ride lots.
Low Density Suburbs
The National Transit Station Atlas calculates the building footprint within ½ mile of a station at 422,000 square feet, on average. Parking lots and garages, on the other hand, take up an average of 812,000 square feet, and 57% of all transit stations are surrounded by more parking than buildings.
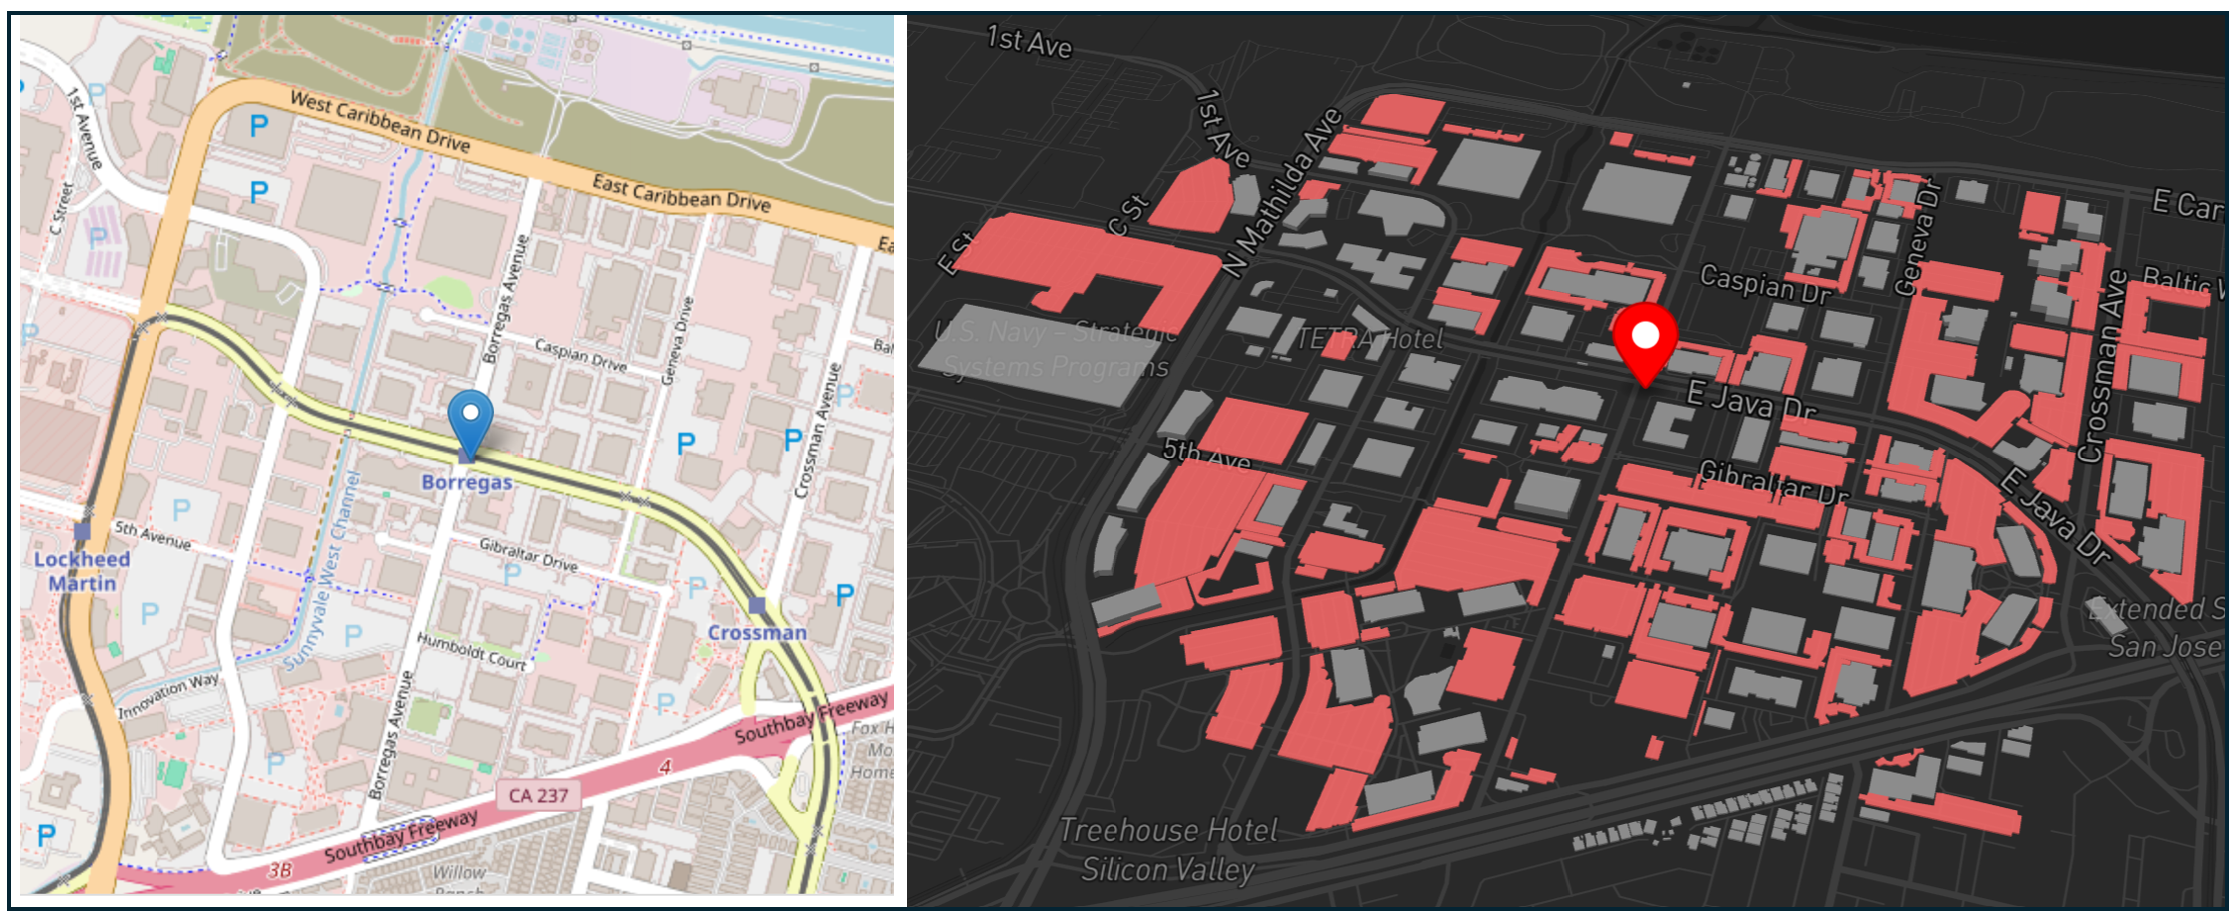
The Santa Clara Valley Transit Authority (VTA) Borregas Station area includes 5.7 million square feet of parking space (#10 out of 5115 stations). In contrast, buildings within ½ mile of the station occupy 469,000 square feet.
Mandatory minimum parking requirements, combined with the simple geometry of surface parking, almost guarantee that suburban commercial land ends up with more pavement than building. A typical space needs about 330 square feet. Suburban office codes typically require 3.0 to 5.0 spaces per 1,000 square feet of building area, and restaurants are often required to have about 10 per 1,000. A requirement of 20 spaces for a 2,000-square-foot restaurant means about 6,000 square feet of parking, three times the size of the building. And because parking requirements are based on all of the building’s floors together, not just the ground it covers, adding floors only means more required parking. The result tends to be low-slung, low-density, auto-oriented neighborhoods, even in places like VTA Borregas Station, shown above, which also includes two nearby light rail stations.
Low Density Downtowns
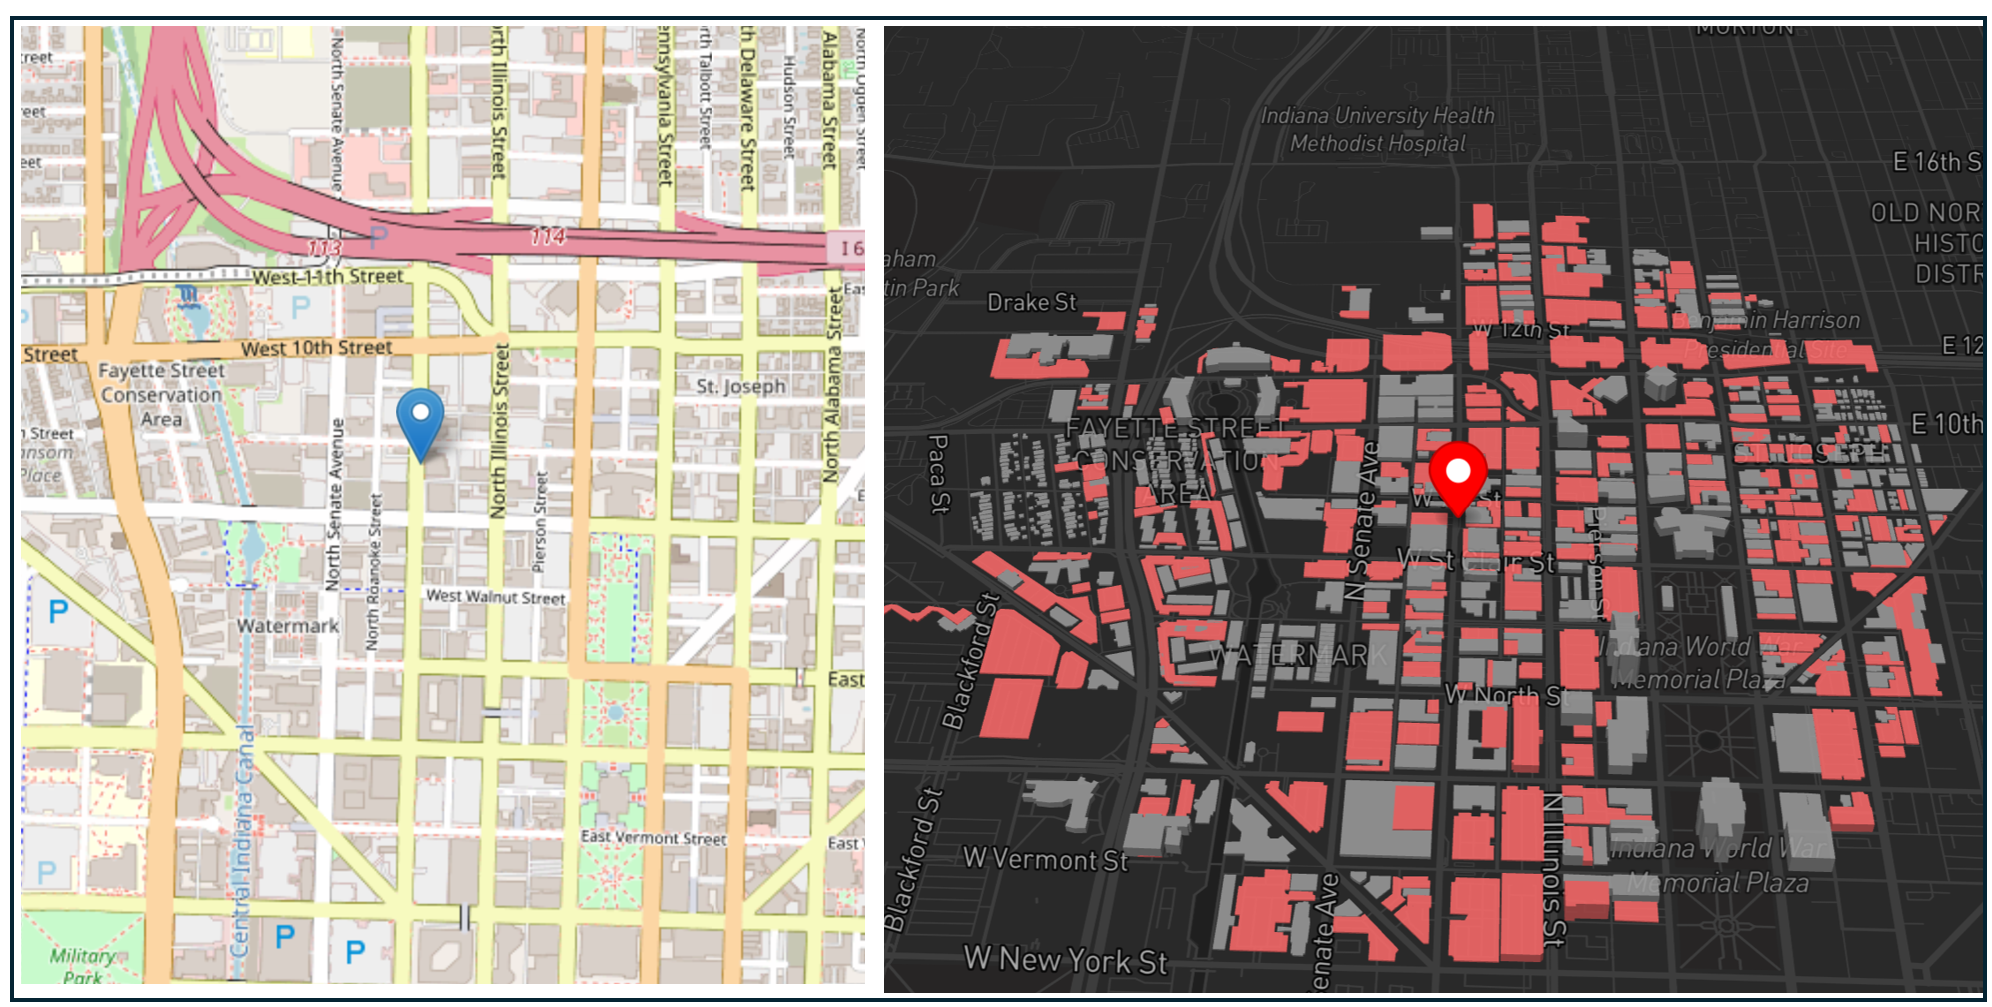
The Indianapolis and Marion County Public Transportation (IndyGo) 9th Street Bus Rapid Transit Station area includes 3.9 million square feet of parking area (#51 out of 5115 stations).
Over-parking is not just a hallmark of suburban sprawl, it’s also downtown. In the middle of the 20th Century, city planners grappled with people moving from cities to suburbs and taking their business with them. Their solution: imitate the suburbs by building ample parking in the urban core. As Graber writes in Paved Paradise, “planners continued to cling to the ideal that downtown revival was just a parking lot away. And they planned accordingly.”
Increasingly, downtowns bought into the municipal parking business, seeking revenue from public parking lots. Interstate highways built through downtowns rendered adjacent parcels useless, and many of these were converted to parking. And cities began to adopt suburban minimum parking codes and require new buildings to include parking on site. The result are hollowed out urban cores. “The more downtown is broken up and interspersed with parking lots and garages, the duller and deader it becomes in appearance” wrote Jane Jacobs in 1961.
How Much Housing Can We Build? Some Assumptions
Almost 2 billion square feet of parking within ½ mile of transit is a lot of developable land. How much housing could we build on it? I’ve based my national total on some “back of the envelope” calculations and reasonable assumptions. These are theoretical estimates which don’t take into account existing zoning, market conditions, or community constraints. Instead, they represent “the art of the possible,” the scale of opportunity, ranging from a “conservative” scenario where fewer housing units are feasible, to an “aggressive” one which envisions more units. Let’s examine each underlying assumption in turn:
Lot Size
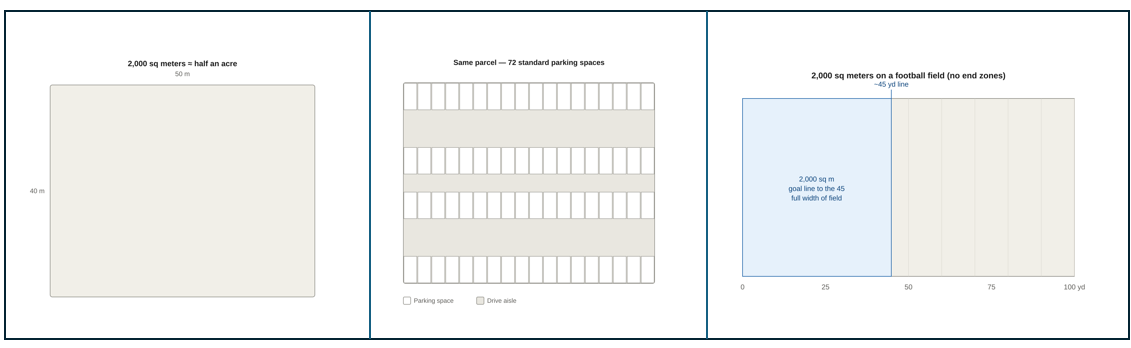
A simple rendering of a 2,000 square meter surface parking lot (actual lot geography will vary)
As stated previously, my housing scenarios are based only on developing lots or garages of 2,000 square meters or more. For context, a 2,000 square meter lot holds around 72 standard parking spaces and are the same size as about half a football field (not including the end zones).
Height Constraints
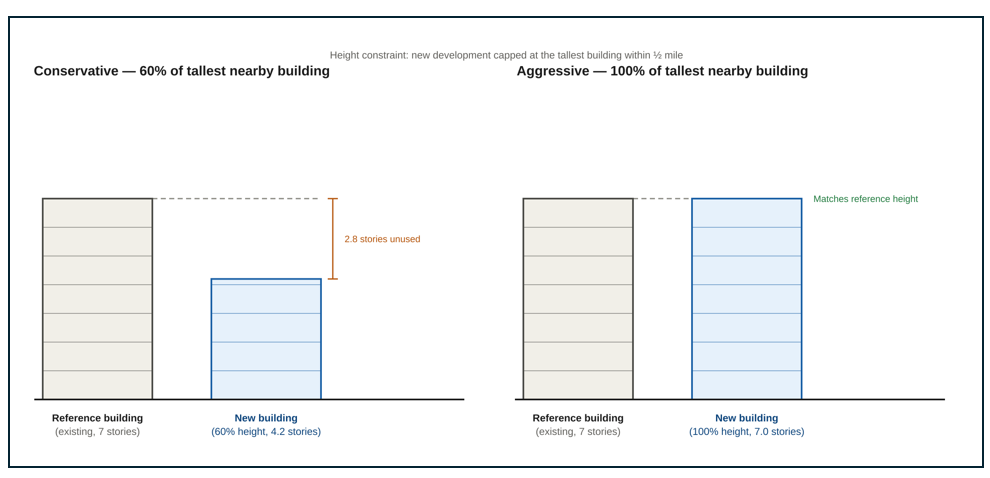
Images of a new development built to 60% and 100% of the tallest nearby building.
One key assumption is that new development around stations would not exceed the tallest existing building within ½ mile of the station. Current building heights may be a proxy for zoning height constraints, and it is important to take a pragmatic approach, adding new housing opportunities without radically changing the character of the surrounding neighborhood. In the aggressive scenario, new development would be 100% as tall as the tallest building. In a more conservative scenario, such as development located near a residential area, a new building would be 60% as tall as the maximum height to afford for a more gradual transition.
How high is development near transit today? The median tallest building near transit stations is 8.7 stories tall and the average tallest building is 12 stories (which accounts for stations in downtown surrounded by skyscrapers). About 15% of station areas have a low-slung urban form where the tallest building does not exceed four stories.
Lot Coverage
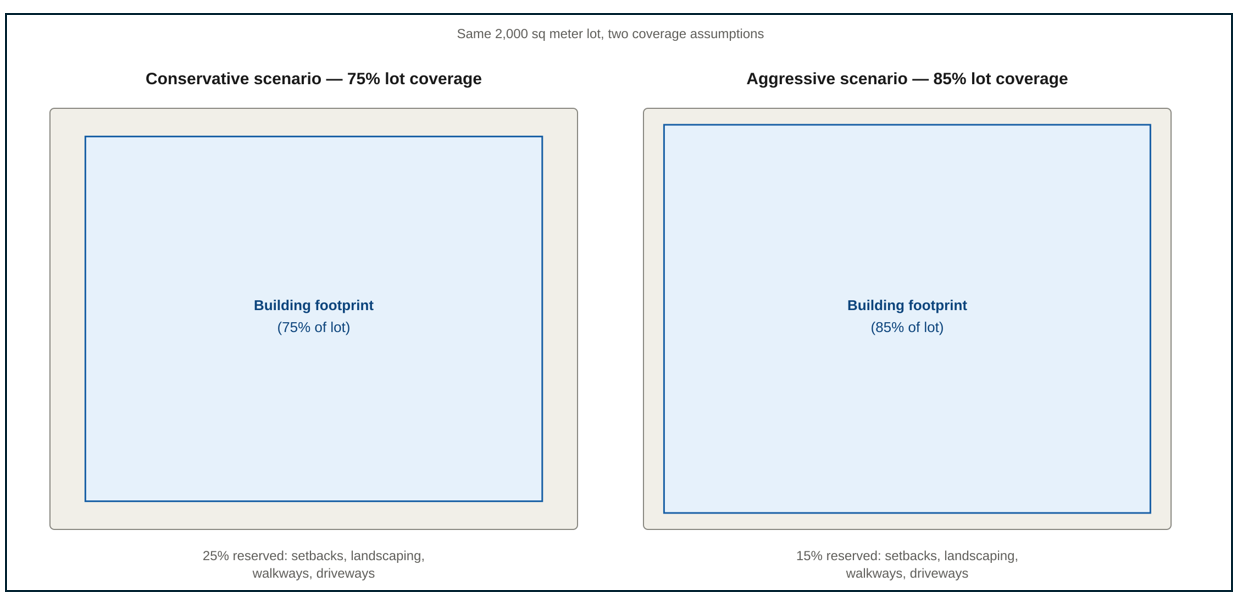
Images of buildings occupying 75% and 85% of a surface lot.
Almost all buildings need setbacks for walkways, landscaping, sidewalks, driveways, and other uses and many zoning codes include setback requirements. My conservative scenario assumes the building will occupy 75% of the total lot whereas my aggressive scenario assumes 85% lot coverage. One critical assumption I am making here is that there are no minimum parking requirements. A development could use a portion of its non-housing lot coverage for parking spaces, but it is not required to.
Space for Non-Residential Use
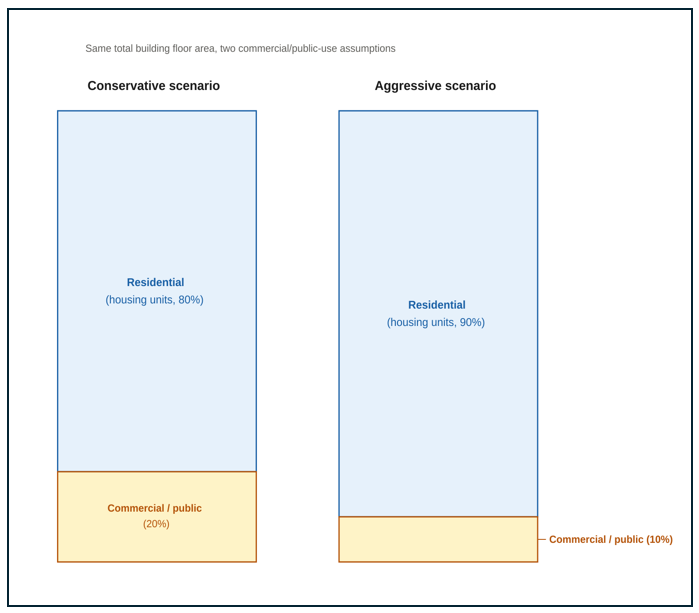
The building on the left includes two stories of public use space and the one on the right includes a single ground floor of public use space.
Most housing developments include some space for lobbies and community gathering and many set aside space for ground floor retail, public services, or other non-residential uses. All buildings require space for stairs, elevators, hallways, and mechanical rooms. My conservative scenario assumes 20% of a building will be non-residential uses whereas a more aggressive scenario reserves 10% for public use.
Apartment Size
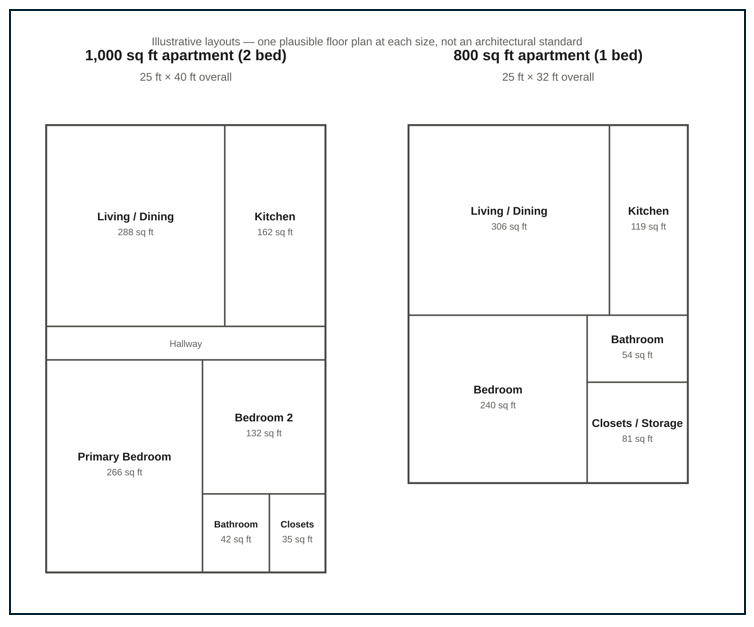
Simple floor plans of a 1000 square foot and 800 square foot apartment.
I am assuming that infill development on parking near stations will be apartments, not detached single family homes, but I don’t assume that people will need to live in shoeboxes. My conservative housing assumption is that each unit in the new building will be around 1,000 square feet whereas my aggressive scenario assumes 800 square feet apartments. A recent analysis of new apartment sizes by RentCafe found an average of 910 square feet in 2025, with studios at 460, one-bedrooms at 735, two-bedrooms at 1,095, and three-bedrooms at 1,355 square feet.
A Hypothetical Development
Putting it all together, the table below suggests a range of new housing units that could be included in a seven-story building on a 2,000 square foot parking lot.
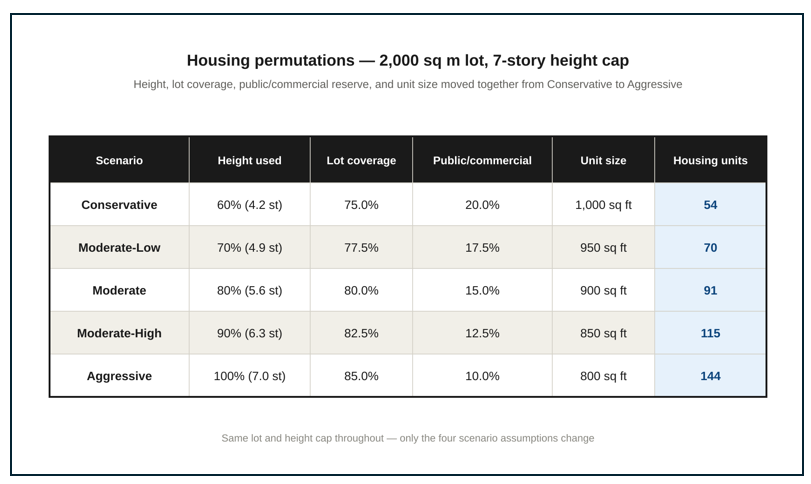
Parking-to-housing conversion scenarios taking into account differences in height, setback, public use, and apartment size.
I know, easier said than done. I can’t say in the abstract whether any of these scenarios would “pencil out” (developer language for making an adequate return on investment) or how much these units would cost. But I do hope that these assumptions and scenarios can help us imagine an alternative future for places near transit that are now used as car storage.
Stations with the Most TOD Potential
In a world where large surface parking lots were fully converted to housing, the station areas that would see the greatest change are those that have both abundant parking and very tall buildings such as the station areas in Houston, Dallas, and Charlotte, shown below:
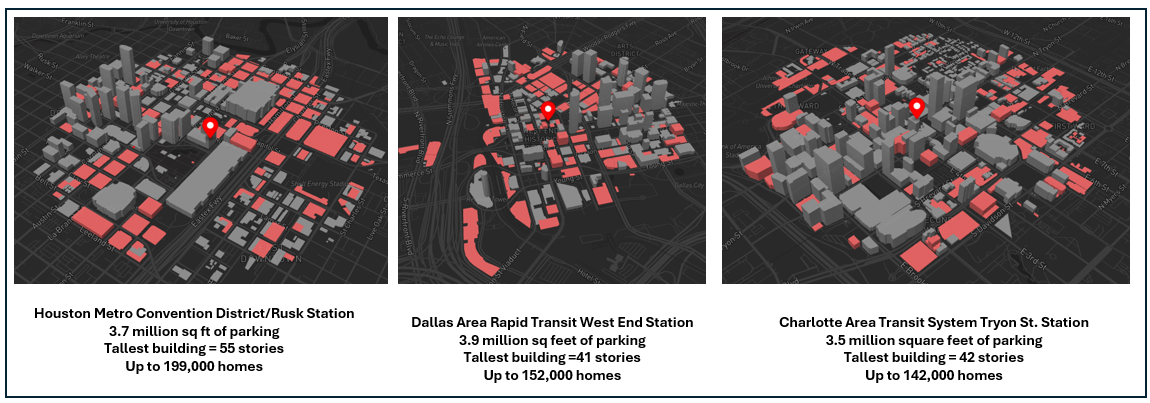
The urban form around three low-density downtown stations with buildings shown in gray and parking in red.
The area around the Houston Metro stations in particular, have the most parking-to-housing potential. The tallest building around a Houston Metro Station averages 25 stories and each station is surrounded by an average of just over 2 million square feet of parking. These dimensions combined with the sheer number of stations in the system’s light rail and bus rapid transit network (each light rail or BRT platform is counted as a separate station for 95 stations in all) means that Houston Metro stations claim 15 out of the top 20 spots for the most housing that can be built on parking near transit.
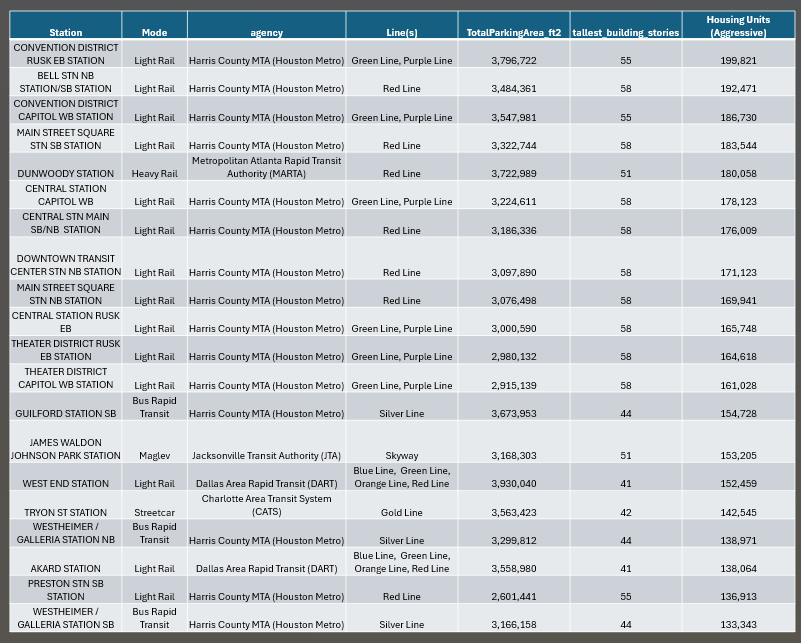
The twenty stations in the United States with the greatest theoretical parking-to-housing conversion potential.
Agencies with the Most TOD Potential
Aggregating housing estimates from the station to the transit agency level (and pro-rating surface parking to account for stations that are within ½ mile of one another) provides two ways of looking at agencies with the greatest potential for parking-to-housing conversion. The first list, shown below, shows the twenty agencies out of 110 systems in the Atlas with the most overall parking-to-housing potential. This includes several sun-belt and western systems along with older systems in the Northeast and Midwest that include commuter rail stations and parking lots.
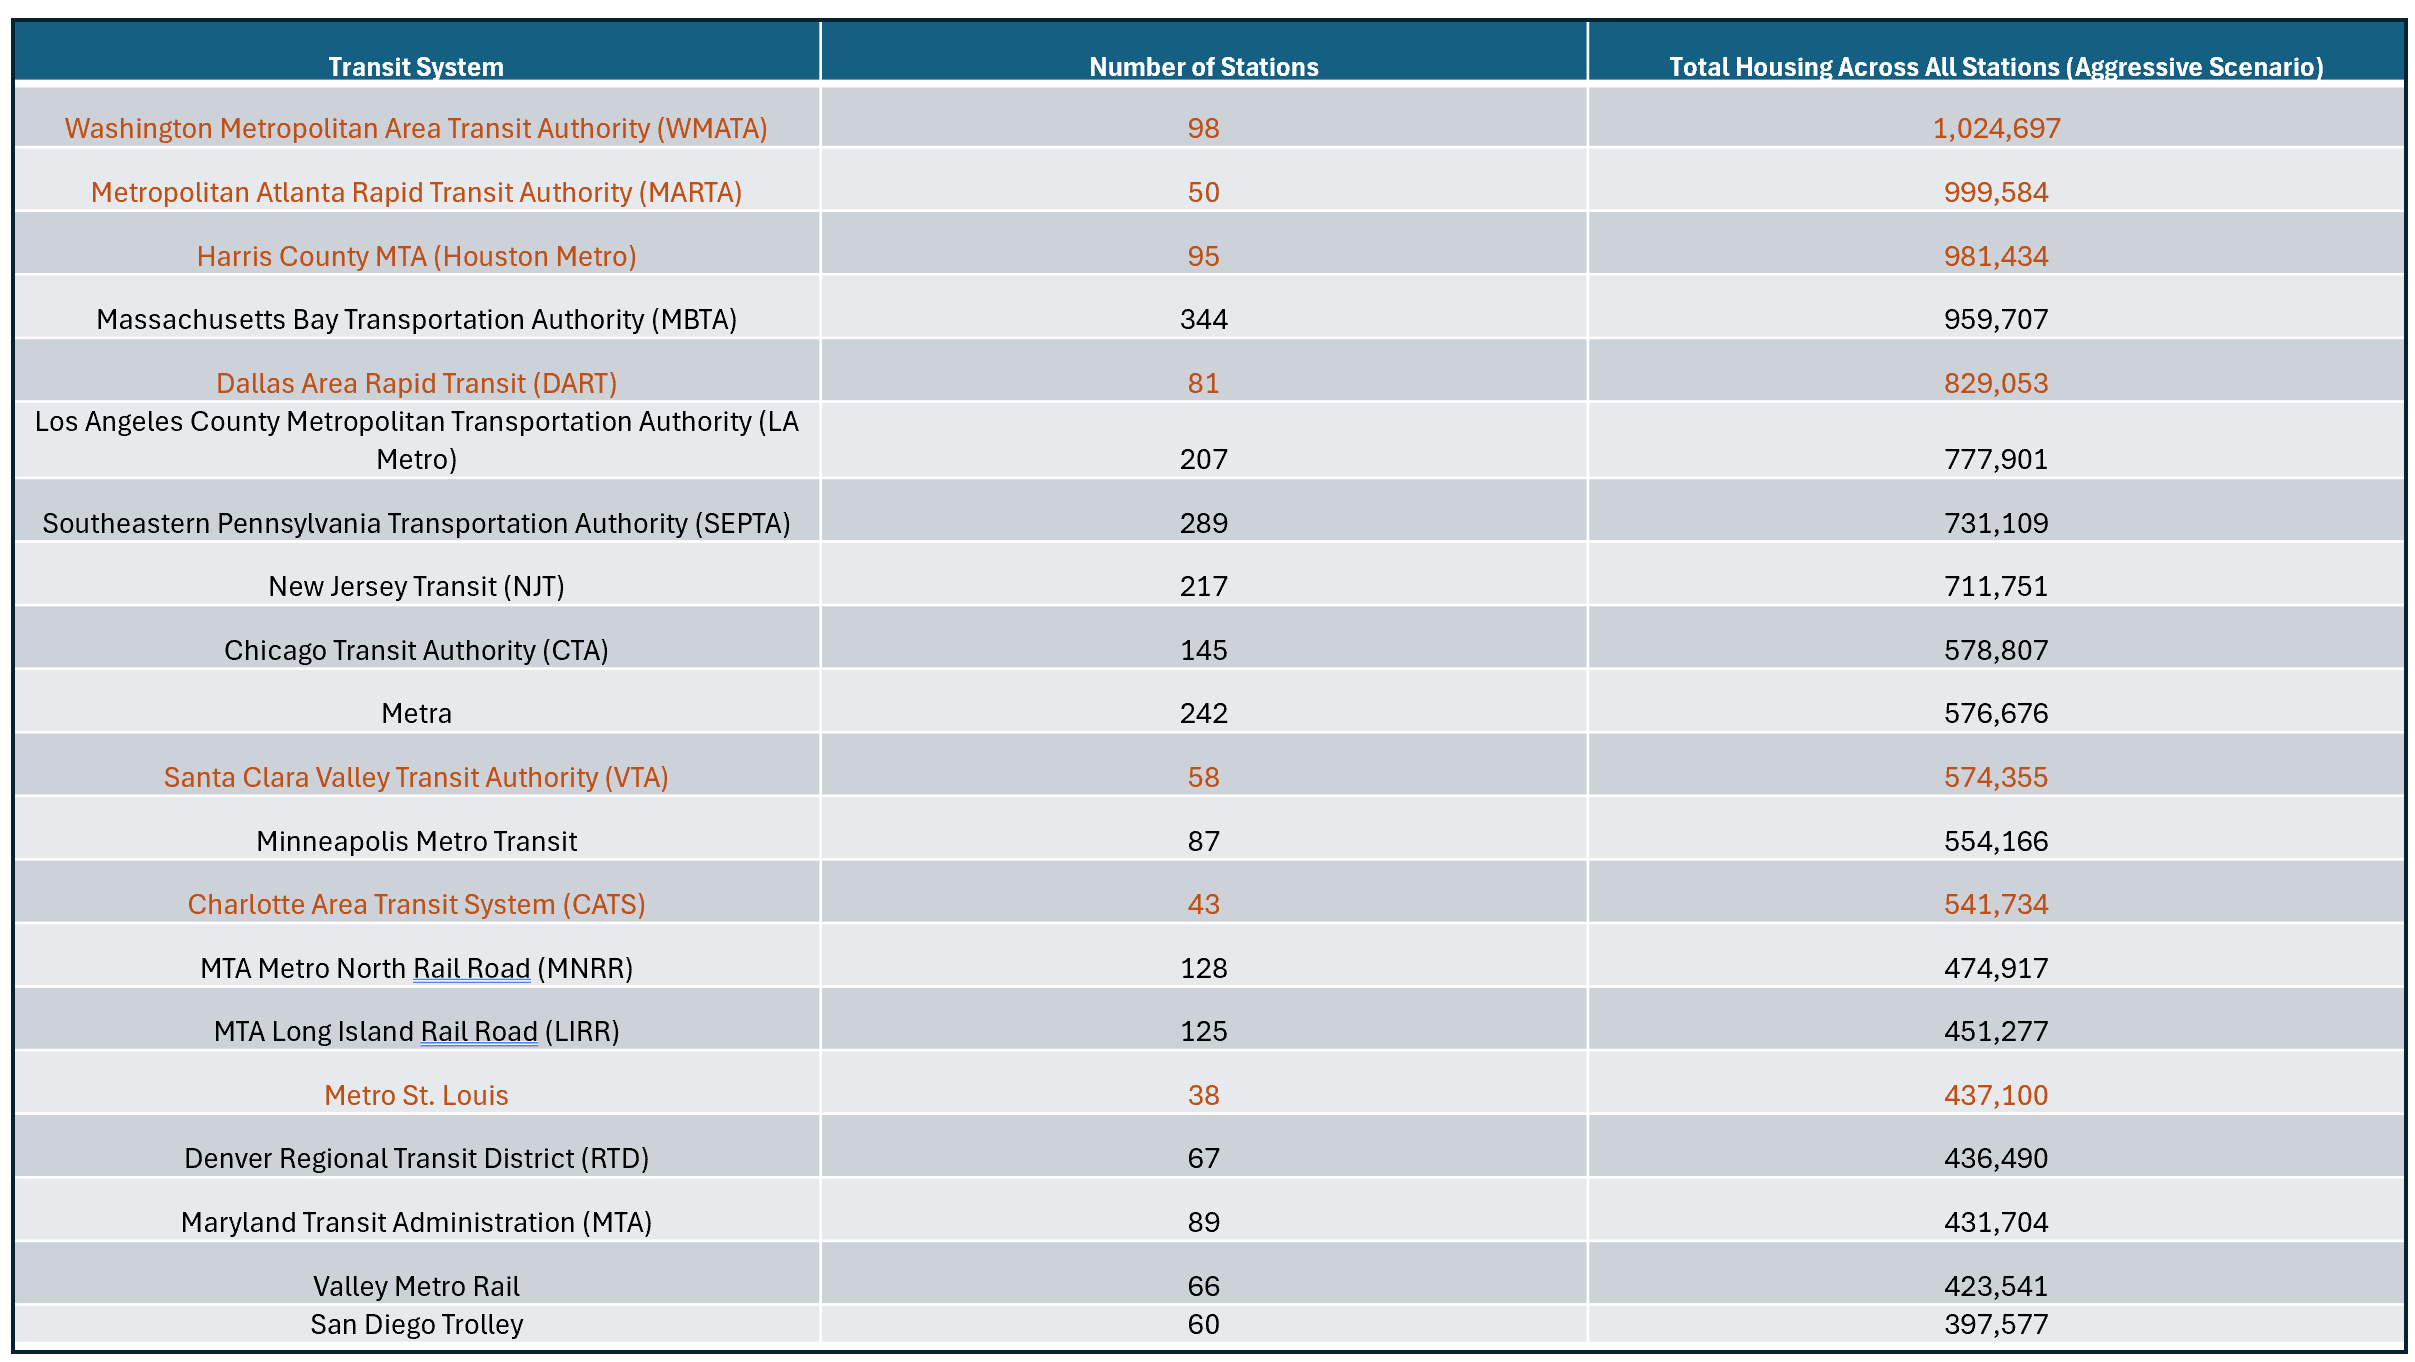
The twenty transit systems in the United States with the greatest parking-to-housing conversion potential based on total number of new homes.
A second list identifies the systems with the greatest housing potential per station. This includes some small systems that run through parking-intensive areas (such as the monorail on the Las Vegas Strip or the Casco Bay Island Ferry terminal) along with some of the same sunbelt systems on the first list. Systems with the greatest housing potential overall and per station are highlighted on both lists in orange.
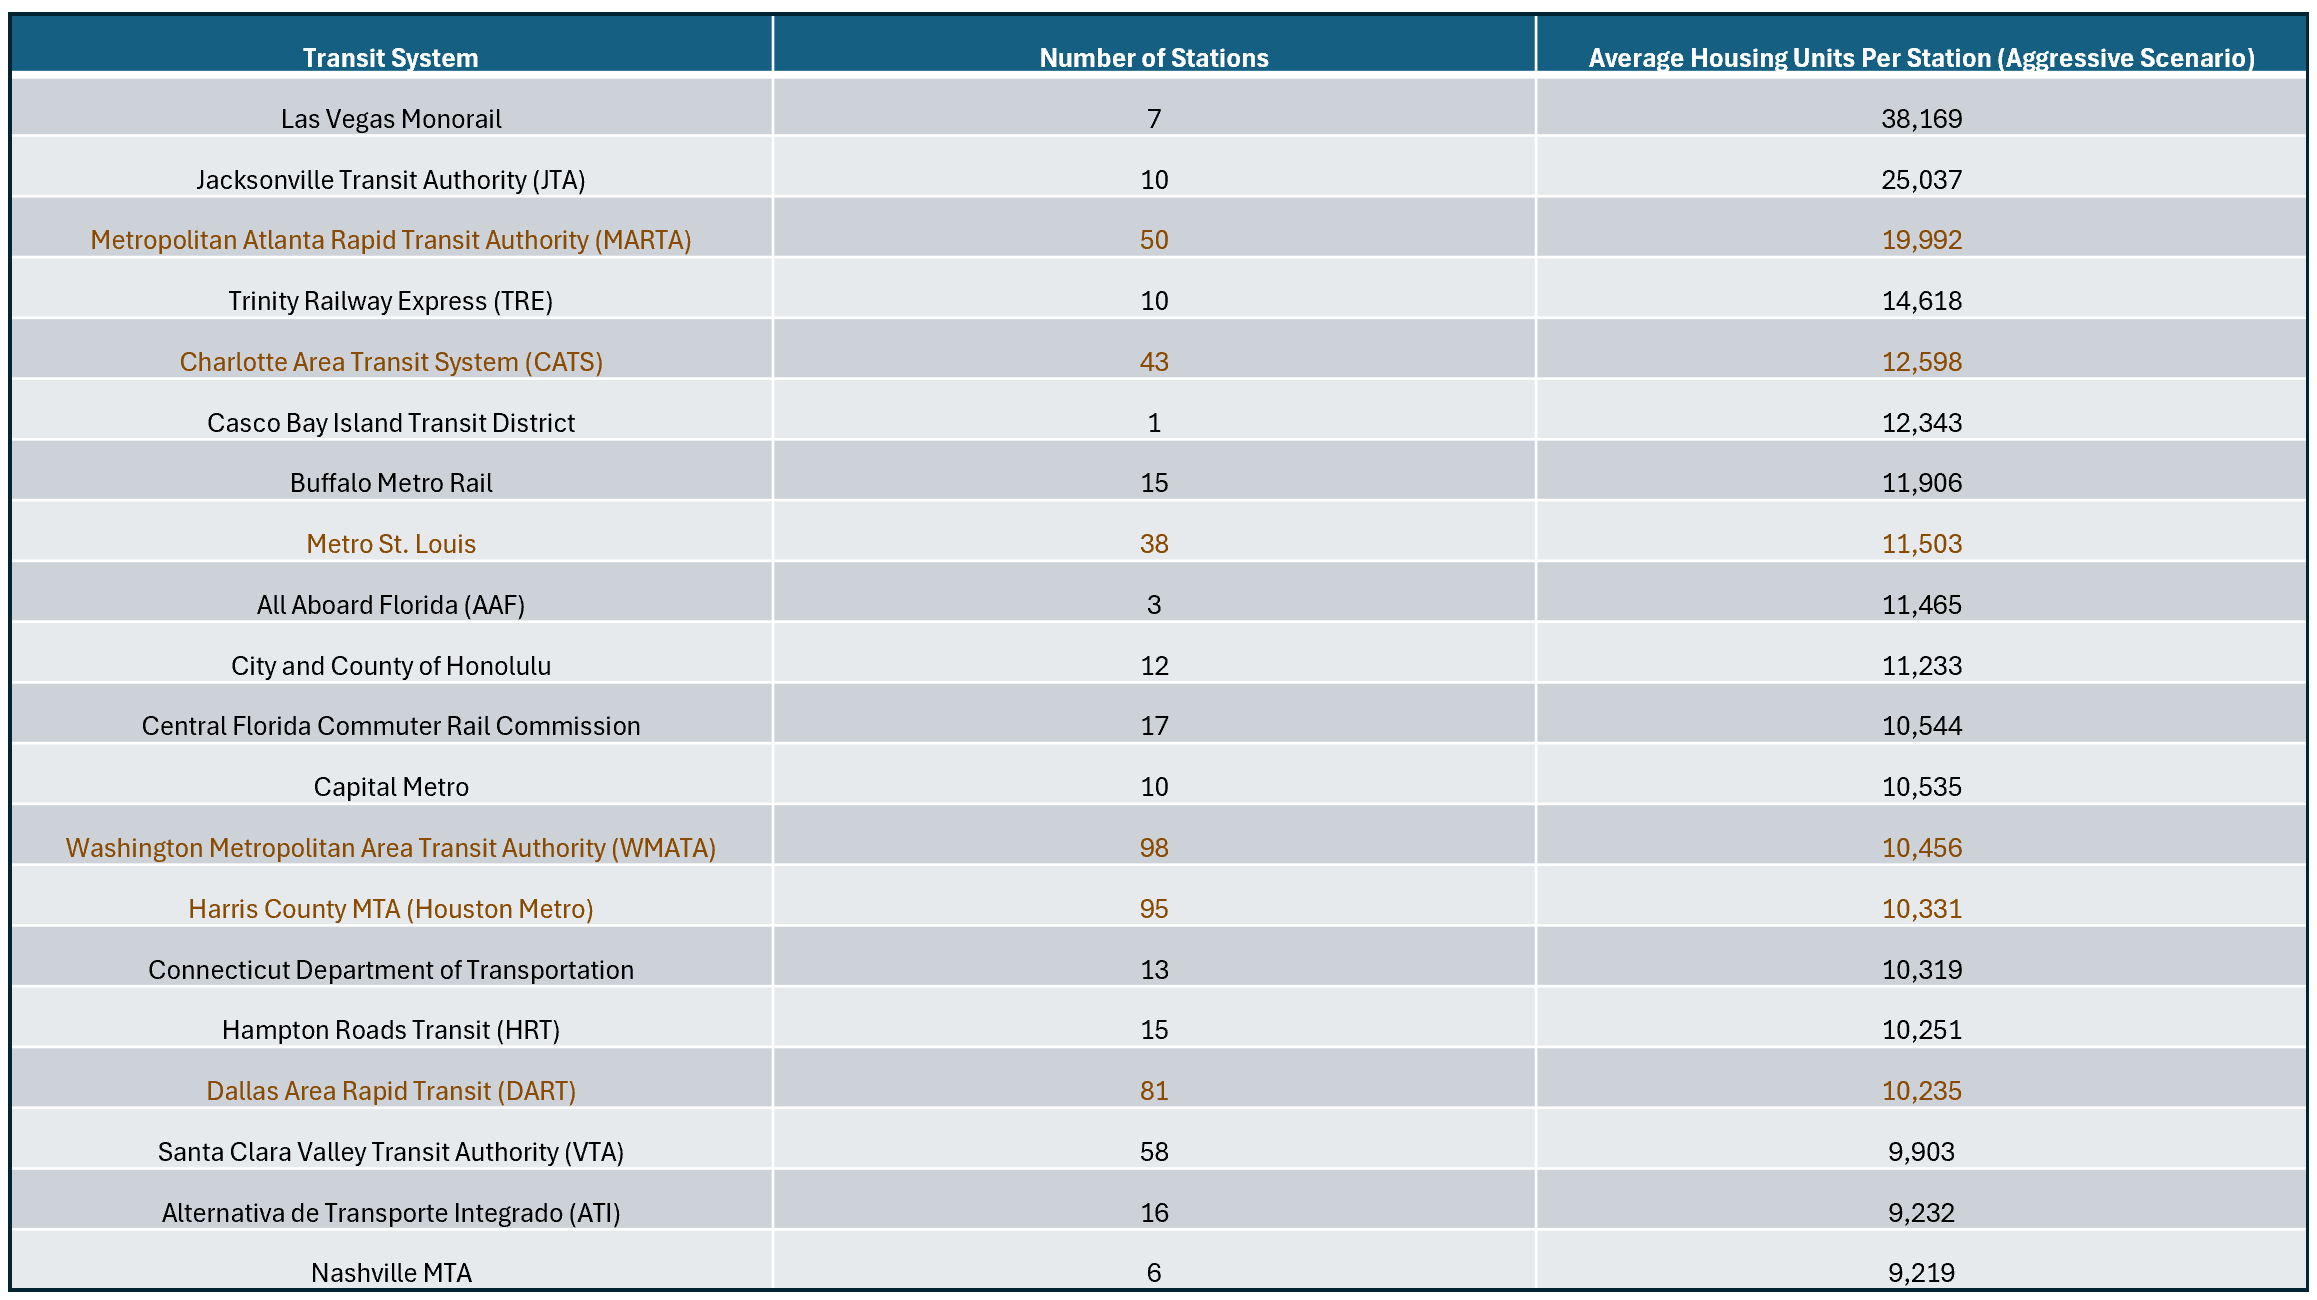
The twenty transit systems in the United States with the greatest parking-to-housing conversion potential based on number of new homes per station.
These sunbelt cities on both lists share a common landscape: older buildings in the urban core were demolished and turned into parking lots, then a building boom produced office towers but not enough to fill every block. Finally, rail transit systems opened downtown in the late-20th and early 21st centuries. Many downtown surface lots are in holding spots for future towers, with speculative developers waiting for the right market conditions to build.
Transit Lines with the Most TOD Potential
TOD planners often envision growth occurring not around a single station but along a corridor of stations linked together on a transit line. For example, Arlington County Virginia’s TOD strategy promoted development around five Metro stations stretching from Rosslyn to Ballston.
The chart below shows the top 20 transit lines (out of 357 nationally) with the greatest TOD potential. As one might expect, the same agencies with the greatest system-wide TOD potential are also listed on the individual lines with great parking-to-housing conversion possibility.
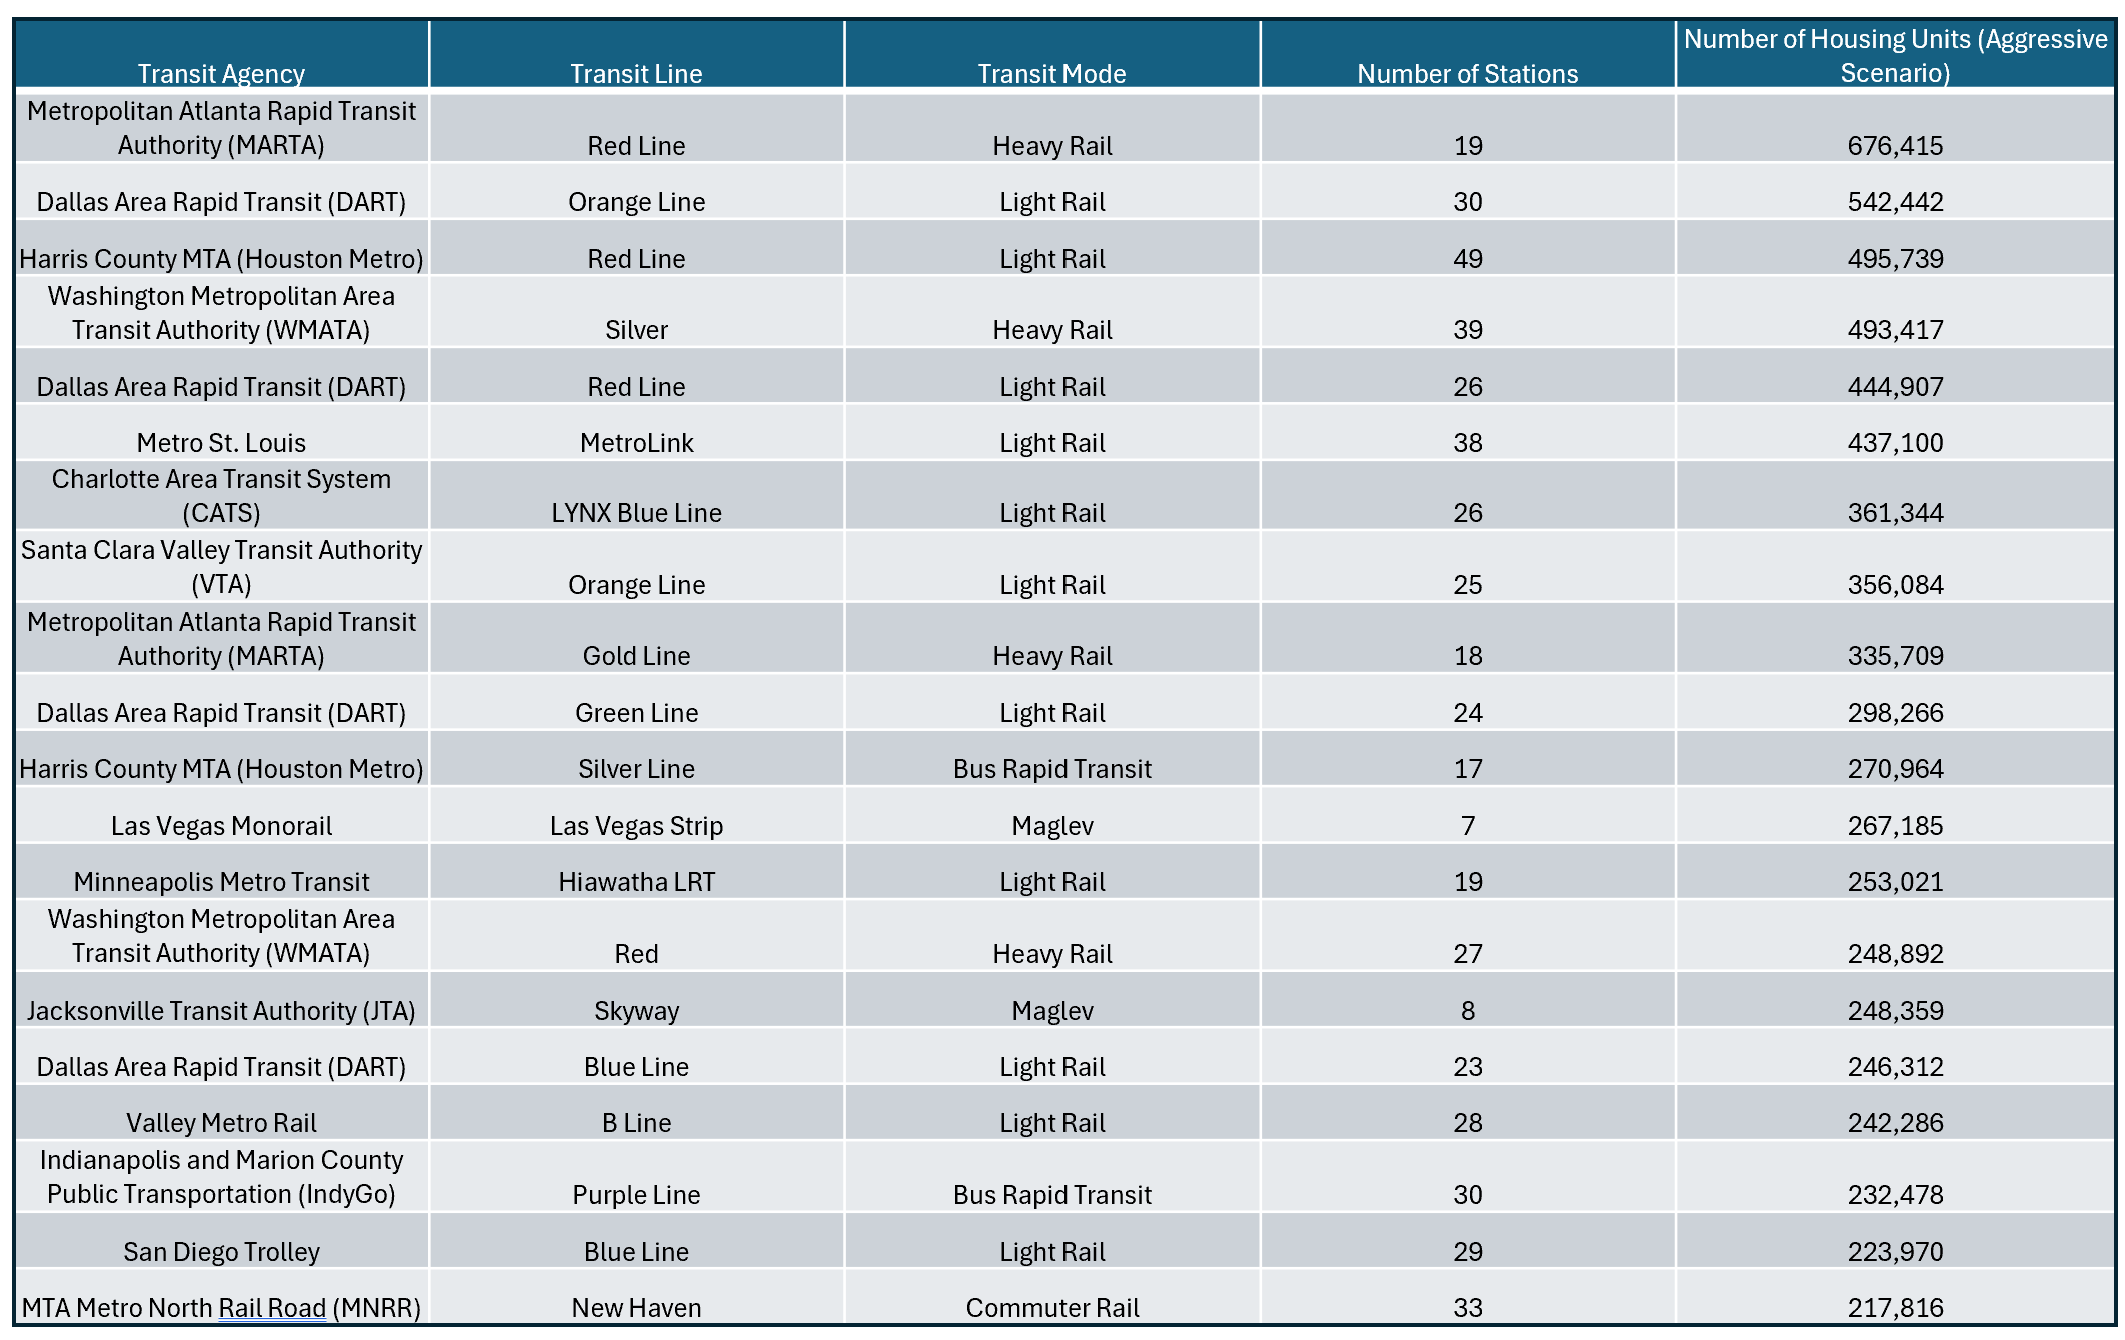
The top twenty transit lines in the United States with the most parking-to-housing conversion potential based on the total number of new homes.
TOD Potential and Housing Need
In order for new housing supply to make the biggest dent in prices, it should be built in areas with the greatest existing shortages. In its May 18 editorial, “America Needs to Build More Housing” the New York Times plotted housing supply and demand in the chart shown below that compares median housing starts to the median housing price (as a share of median income) in metropolitan areas over the past ten years.
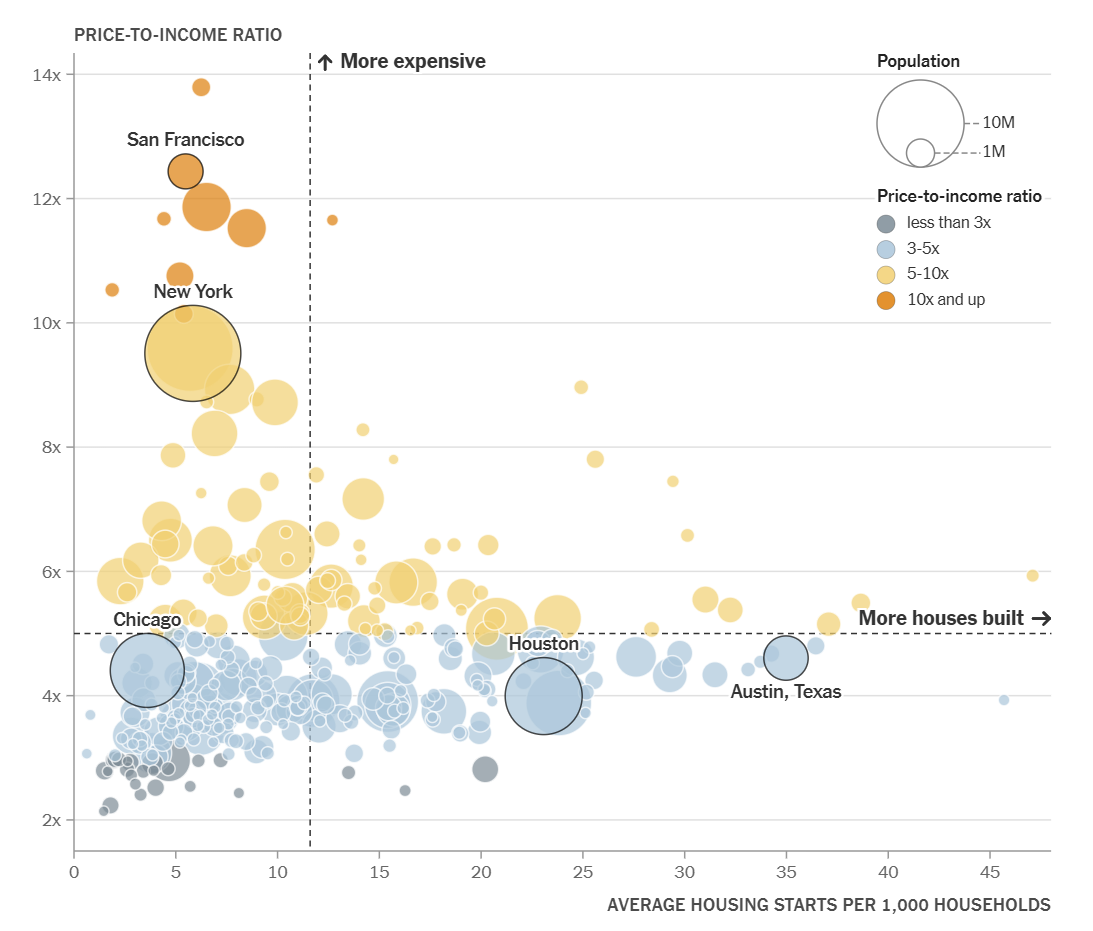
Metropolitan areas that have built more housing over the past decade generally have lower home prices relative to income. Chart: The New York Times Opinion, from the editorial "America Needs to Build More Housing," May 18, 2026.
Metropolitan areas in the bottom right-hand quadrant of the chart have built housing more aggressively and home prices have been lower than the national average. This includes cities in the same sunbelt areas such as Houston, Dallas, Charlotte, and Atlanta that have the most existing capacity near transit and raises the question: even though there is ample space to build more homes, would additional housing be in high demand?
On the other hand, the top left quadrant shows regions that have not built as much housing and where prices are higher relative to incomes, and these are places where parking-to-housing conversion may make more economic sense. Some of these areas, such as San Jose, CA where home prices are 11.5 times the median income, have abundant parking-to-housing conversion opportunities. It is theoretically possible to build over 574,000 homes around Santa Clara VTA stations (ranking VTA #11th in TOD potential overall). Other cities with high housing prices have significant TOD potential. In San Francisco, where the median home price is 12.4 times the median income, there is room to repurpose 46 million square feet of station-area parking to 105,000 homes. In Los Angeles, where the median home price is 9.6 times the median income there is capacity to build over 292,000 homes on 67 million square feet of parking.
And even though most New York City subway station areas are densely developed with few large parking lots, it’s still theoretically possible to build up to 362,000 new homes near the system’s 472 stations on infill parking across the five boroughs.
Tools and a Vision for TOD
My theoretical framework for building abundant housing points to some practical policies and practices that make it easier to build. Municipalities can scrap mandatory minimum parking requirements so that new development need not replace an old parking lot with a new one. Zoning can be updated to increase building heights and reduce setback requirements near transit stations. Building codes can include options for smaller elevators or single-staircase dwellings which increase the number of units in a building that can be built without compromising safety. Government can change the mix of taxes raised on land versus improvements to land to provide financial incentives to develop underutilized lots.
These and other practices are being tried out around the country, thanks to a newfound interest in addressing the housing shortage. I don’t have any brilliant new ideas to offer. Instead, I want to remind us that we have the ability to imagine a different long-term future for our cities and ourselves. If we don’t imagine our future, someone else might imagine it for us, and we might not like their results. After all, people once imagined the network of urban highways and strip malls that we live with today. A vision of abundant and affordable housing where parking lots are now may seem like a pipe dream, but who’s to say what our cities will look like fifty to a hundred years from now? If we can sustain our vision over time, our grandchildren may thank us.
