The Eight Types: A National Typology for Transit-Oriented Housing
By Mohammed Golam Kaisar Hossain Bhuyan and David Schneider
In his 2023 New York Times Opinion Piece, “How to Make Room for One Million New Yorkers” Architect Vishaan Chakrabarti offers a way to add 500,000 new housing units across the city’s five boroughs “without radically changing the character of the city’s neighborhoods or altering its historic districts.” His firm, Practice for Architecture and Urbanism identified areas within 1/2 mile of the city’s transit stations and ferry terminals, excluding areas that might be prone to flooding. He then identified underutilized land (i.e. surface parking, single story buildings, or vacant land) and calculated how many housing units could be added without building any higher than nearby structures.
For example, a single-story building in Crown Heights, Brooklyn could be converted into 58 housing units without rising any taller than the five-story building next to it. A vacant lot in a residential neighborhood could house a three-story, low-rise apartment. On the other hand, developers could add 242 units by transforming a low-rise building in Flushing Queens into apartments without exceeding the height of nearby towers.
Chakrabarti’s approach is pragmatic. Rather than imagining a 21st century urban renewal program where neighborhoods are redeveloped wholesale, he seeks to work with the grain of the built environment instead of against it.
Transit-Oriented Discoveries extends this analysis to explore how communities across the United States can add new housing without building “a forest of skyscrapers” as Chakrabarti put it. We analyzed areas within 1/2 mile of almost 5,000 rail, bus rapid transit, and ferry stations in the United States collectively operated by 102 transit systems and serving millions of people from the metropolises of New York, Chicago, and Los Angeles to smaller cities like El Paso Texas and Norfolk, Virginia as well as suburban townships and exurbs.
While every place has its own history and character, it has become increasingly unaffordable to live in America’s cities, large and small. According to the Pew Research center, the Federal Housing Finance Agency’s national House Price Index, a gauge of how selling prices for single-family homes have changed over time, was 57.8% higher in July 2024 than it was in July 2019. (For comparison, the Consumer Price Index – which measures price changes for a broad range of consumer goods and services – rose 22.8% overall between September 2019 and September 2024). One reason for the increase is that the United States is not producing enough housing supply to meet demand, especially supply of entry-level single-family homes, defined as those smaller than 1,400 square feet. The peak year this century for new homes of that size was 2004, when 186,000 were built (12.1% of all single-family homes built that year). In 2023, however, only 87,000 new single-family homes (8.7%) were under 1,400 square feet, according to the Census Bureau. Renters are particularly burdened by housing price increases, with over 50% of renters paying more than 30% of their income towards housing.
Following in Chakrabarti’s footsteps, the Transit-Oriented Discoveries database estimates new housing units that could be built on surface parking lots and parking garages within 1/2 mile of every rail, BRT, and ferry station in the United States without building higher than the tallest building in the area. (You can find a sample of visuals and estimates here or subscribe for full platform access).
This post extends the principles of context sensitive development to transit station areas across the United States. We developed a framework that recognizes the diverse urban fabrics surrounding America's nearly 5,000 transit stations, from exurban villages served by commuter rail to dense downtown cores anchored by heavy rail systems, each requiring tailored strategies that balance housing production with community preservation.
Coding a Digital Surveyor
Our approach uses data from OpenStreetMap (OSM), a crowd-sourced, digital map of the world (like Wikipedia for maps) where uses have entered information about urban form. (You can read this post for an example of how building data is provided to OSM). Cities are complex and dynamic environments, but sometimes complex phenomena emerge from the interaction of simple underlying components. We collected data on three such components: the number of buildings within 1/2 mile of a transit station, the footprint (i.e. land covered) by these structures, and the height of the buildings. Building count and footprint tells us about grain and texture—whether we're looking at a neighborhood of many small structures or few large ones. Total footprint reveals how much of the available land is actually built upon, distinguishing between dense urban fabric and spacious suburban patterns. Average height adds the crucial third dimension, differentiating between sprawling single-story developments and vertical urban cores.
To collect this data, we developed and ran code that uses the stations in the Transit-Oriented Discoveries database and automatically measures the count, footprint, and height variables around each station. It's like having a digital urban planner that can quickly survey entire neighborhoods and tell you about the building patterns. (Feel free to skip the next few paragraphs if you’re not interested in the code and just want to review the results)
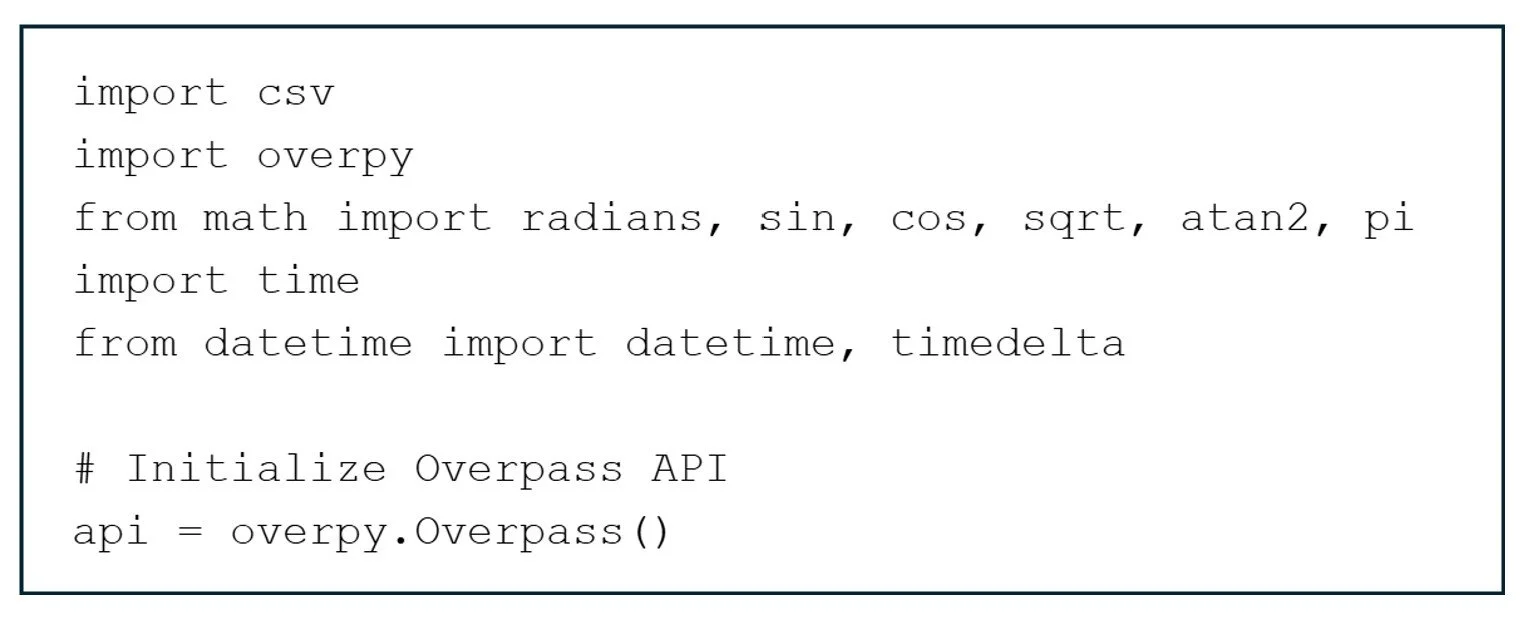
Our first code block, shown below imports a set of tools needed to perform calculations and data analytics. This includes overpy that lets the program talk to OpenStreetMap and request building information, csv, for reading and writing spreadsheet files, several geometric calculators needed to measure distances and areas on Earth's curved surface, and time & datetime which are like stopwatches and calendars to track how long the analysis takes and show progress.
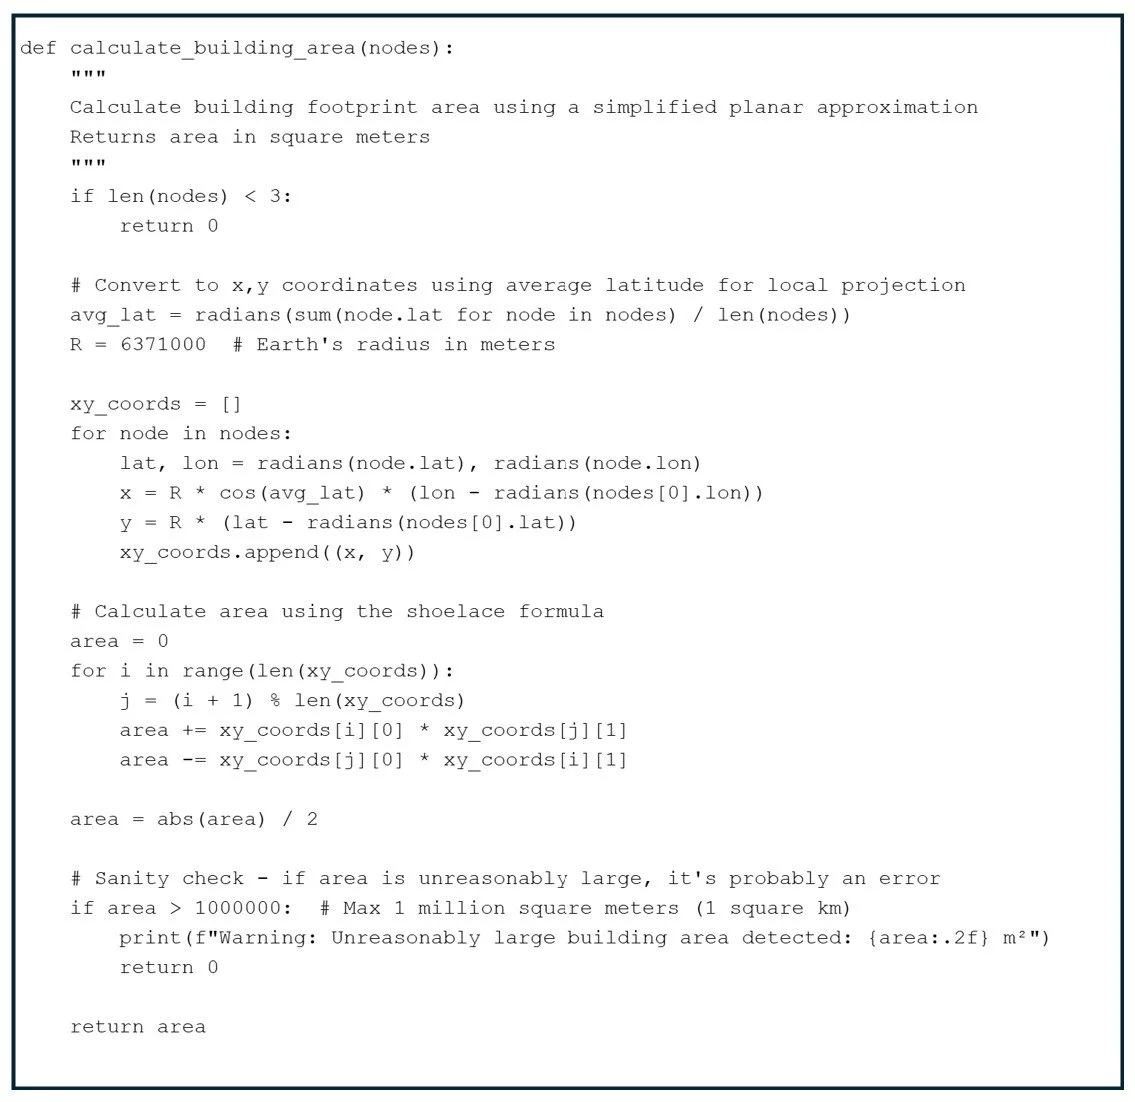
We then ran a function to calculate building footprints while taking into account the Earth’s curvature. Buildings on maps are stored as a series of GPS points (like connecting the dots), but GPS coordinates are on a curved Earth while area calculations work best on flat surfaces. It's like trying to measure a curved piece of paper - you need to flatten it first.
The code includes a check to ensure that buildings identified via the Overpass API have three corner points (you need at least 3 points to make a shape with area.). If so, the code finds the center of the building and uses that location to create a "local flat map" - like pressing a small piece of curved Earth flat so we can measure it accurately. This transforms each GPS coordinate (latitude/longitude) into actual distances in meters from a reference point, creating a precise floor plan. It also includes a sanity check that disregards any building with a footprint of 1 million square meters or higher.
Our second function calculates the distance between the transit station location and the location of each building while, again, accounting for the curvature of the earth. This involves converting coordinates from degrees to radians with a formula called the “Haversine formula” and multiplying the results by the Earth’s actual radius (6,471,000 meters) to get the distance in meters.

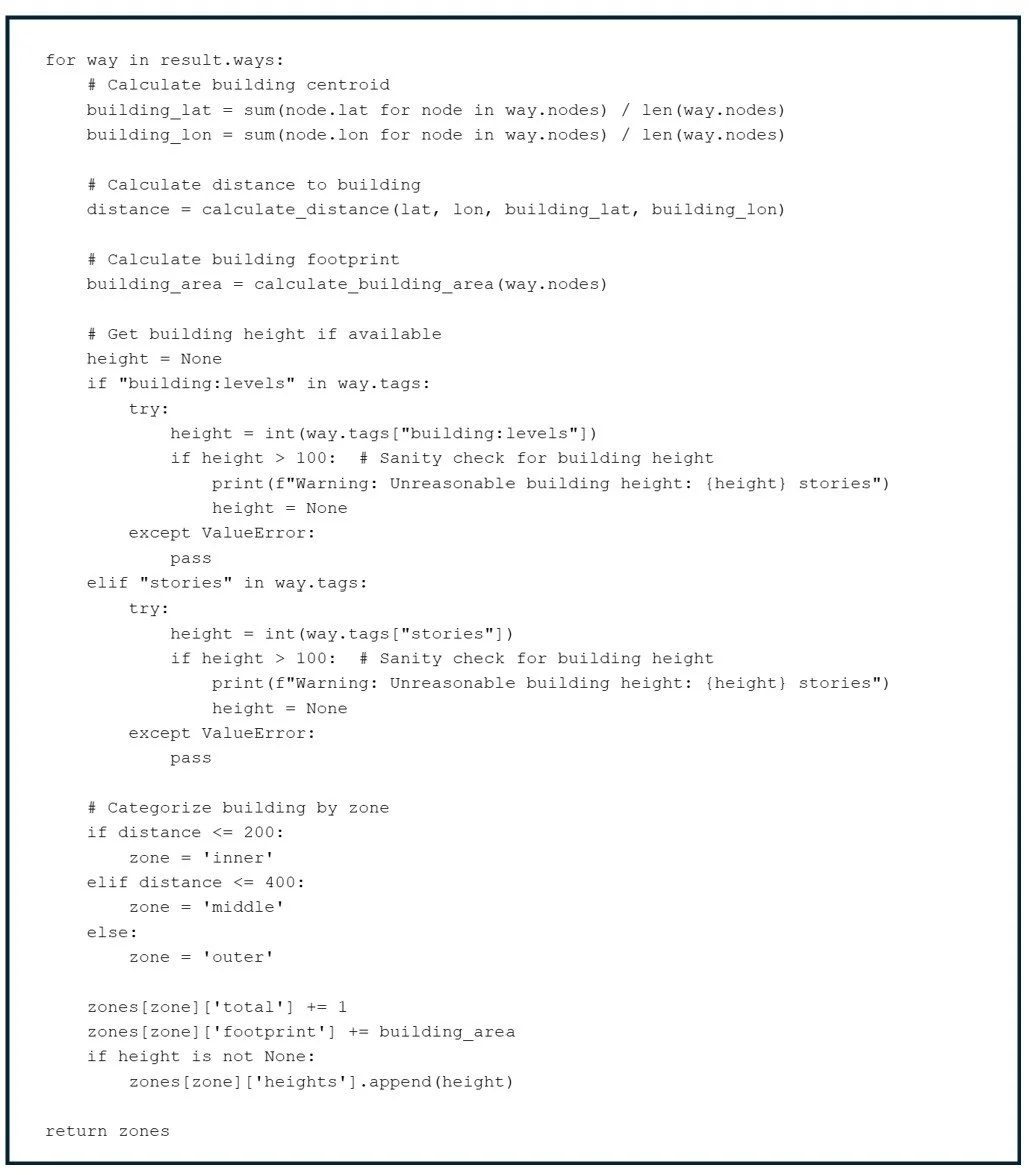
Next, our code fetches data from OpenStreetMap. This first part handles getting the building data from OpenStreetMap and sets up the organizational structure. The code snippet below asks OpenStreetMap "Give me all buildings within a radius of 800 meters of this transit station” and sets up three labeled containers (inner, middle, outer zones based on distances from the station) ready to receive building information. (A subsequent post may focus on changes to urban form as distance from a station increases).

This second part takes each building found and processes it - measuring, analyzing, and sorting it into the appropriate zone. For every building found, the code finds its center point, measures the distance to the transit station, calculates its ground footprint, tries to determine its height, decides which zone it belongs in based on distance, and files all the measurements in the appropriate zone container. At the end, it returns the three organized collections of building data.
The function, shown below, performs descriptive statistics on the data collected, including a count of all buildings found, the combined ground area of all buildings, and building height, if available, including the minimum, maximum, and average height of all buildings tagged with height (in meters or in stories). The code also calculates the average footprint per building (the total footprint of all buildings divided by the number of buildings within 800 meters of the station).

The final section of the code (not pictured here) loops through the 5,000 station coordinates in the Transit-Oriented Discoveries database, performs the calculations described above, and saves the results into a csv file. Ultimately, our code transforms a simple list of transit station locations into a comprehensive urban form database with detailed building metrics, development patterns, and transit-oriented development assessments.
A few important caveats: While OSM data is easy to collect, its accuracy and completeness depends on the effort and attention to detail provided by the community of volunteer mappers. In general, the OSM community tends to focus on more populated areas so data in cities tends to be more complete and up to date than in small towns or sparsely populated areas That said, we wanted to highlight several gaps that readers should watch out for.
First, after visually inspecting all station areas, we identified that 744 stations in the dataset (about 15% of all stations) are “under-mapped” because OSM has provided a street grid but no buildings have been added to the map. Under-mapped stations are more frequent in stations serving suburban and exurban areas (such as commuter rail). You can read more about our process for identifying under-mapped stations here.
Second, tagging a building’s height, either in stories or meters, is optional and there is a lot of missing height data. On average, only 15% of buildings across all station areas are tagged with height metrics. 1,594 stations (32%) have 0% of buildings tagged with height, 2,758 stations (56%) have between 0-50% coverage, 596 stations (12%) have 50-99% coverage, and only 13 stations have achieved 100% height tagging. Stations with more buildings tend to have slightly more buildings tagged with heights, but the relationship is not strong (correlation 0.09).
Clearly, we would need a different data source (or put a lot of work into updating the OSM height data) In order to develop a comprehensive transit station area building census. However, the data we have is sufficient for the purposes of this post which is to provide some illustrative examples of different station areas which can serve as a conversation starter and jumping off point for additional data gathering and analysis.
The Myers-Briggs of Metropolitan Areas
Who doesn’t love a good archetype? From the ancient Greeks dividing personalities into four temperaments to astrology's twelve zodiacal character traits to the five love languages, we have long s been drawn to systems that bring order to complexity through classification.
Urban planning data analytics is no different. Rather than treating America's nearly 5,000 transit stations as an undifferentiated mass of dots on a map, we can recognize distinct patterns in their surrounding urban fabric, each representing a development type that informs both the challenges and opportunities for adding housing in contextually appropriate ways.
Our approach to typologies begins by comparing each of our three features, building count, footprint, and height, against the feature’s mean across all stations. The mean building count around is 1390 structures, the mean building footprint, across all structures, is 405,253 square meters (for context, the area of a circle with an 800 meter radius is 2,010,619 square meters) And the mean building height is 3.4 stories. We created eight permutations based on whether the building count, footprint, and height was higher or lower than the national average.
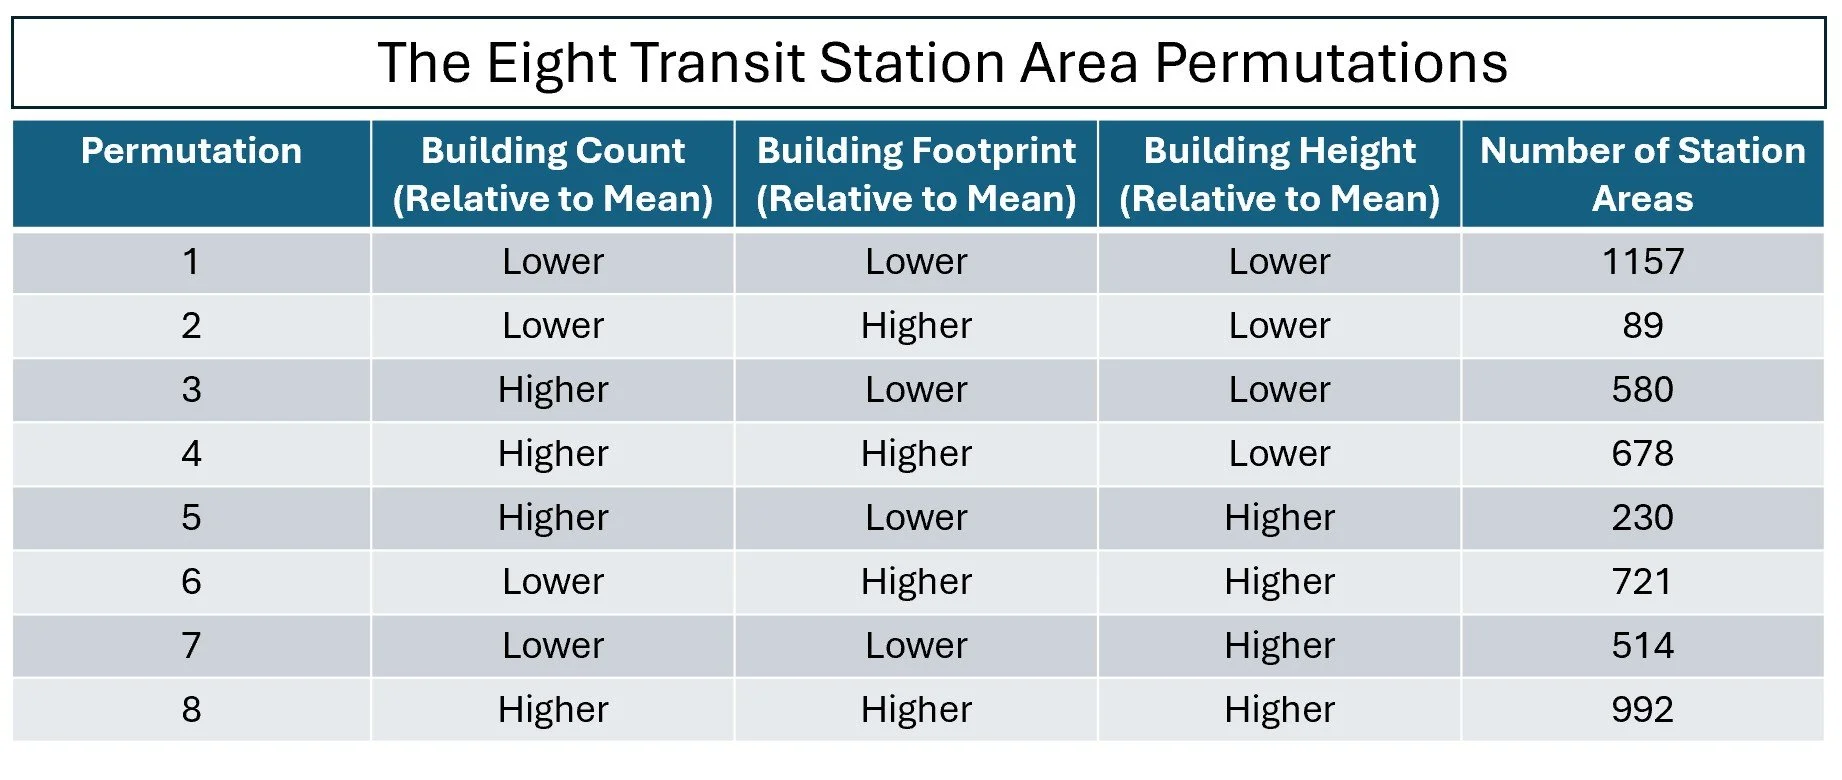
We then added in each station’s transit mode to identify relationships between the station area permutation and the type of transit serving the station. There’s a lot of data in the visual below, and we’ll focus on a few interesting combinations in our station area summaries later on.

We also generated pairwise correlations to look at the relationship between the three features. Not surprisingly, the total building footprint increases as the number of buildings increase: the more structures there are, the more ground is covered (see top left plot). On the other hand, there doesn’t seem to be a strong positive correlation between station areas with high numbers of buildings and higher building heights (top right). And the relationship between building footprint and height is not particularly strong—some areas that are largely built out include tall buildings, while other areas do not (bottom left). The chart on the bottom right plots all three features in three-dimensional space with building count on the x axis, building height on the y axis and the building footprint rendering in three-dimensional space. This suggests that urban form around transit stations isn't driven by a single underlying factor. You can have areas with many small buildings (high count, low height), few large buildings (low count, high footprint), or tall buildings on small footprints (low footprint, high height) etc.
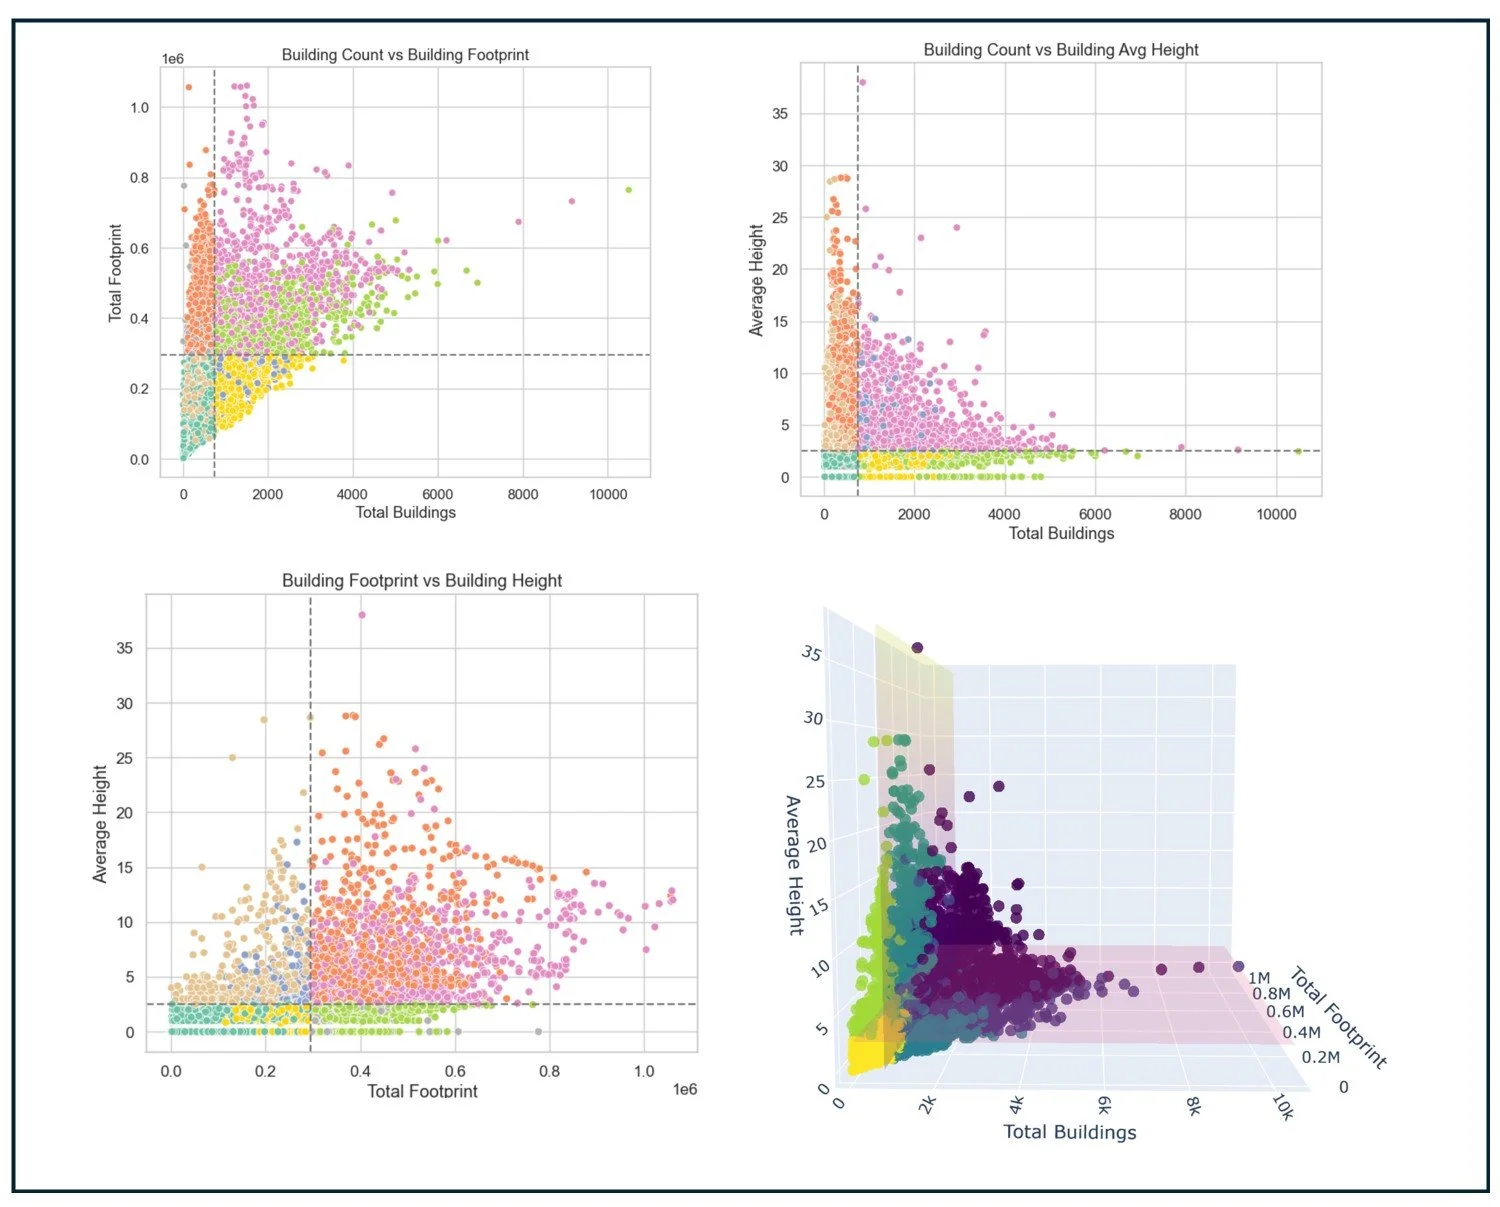
The dashed lines represent the national average for each feature. and the colored dots represent the eight typologies. Total footprint is shown on a scale of between 0 and 100% of the area within ½ mile of a station occupied by buildings. You can explore the data further at this interactive dashboard.
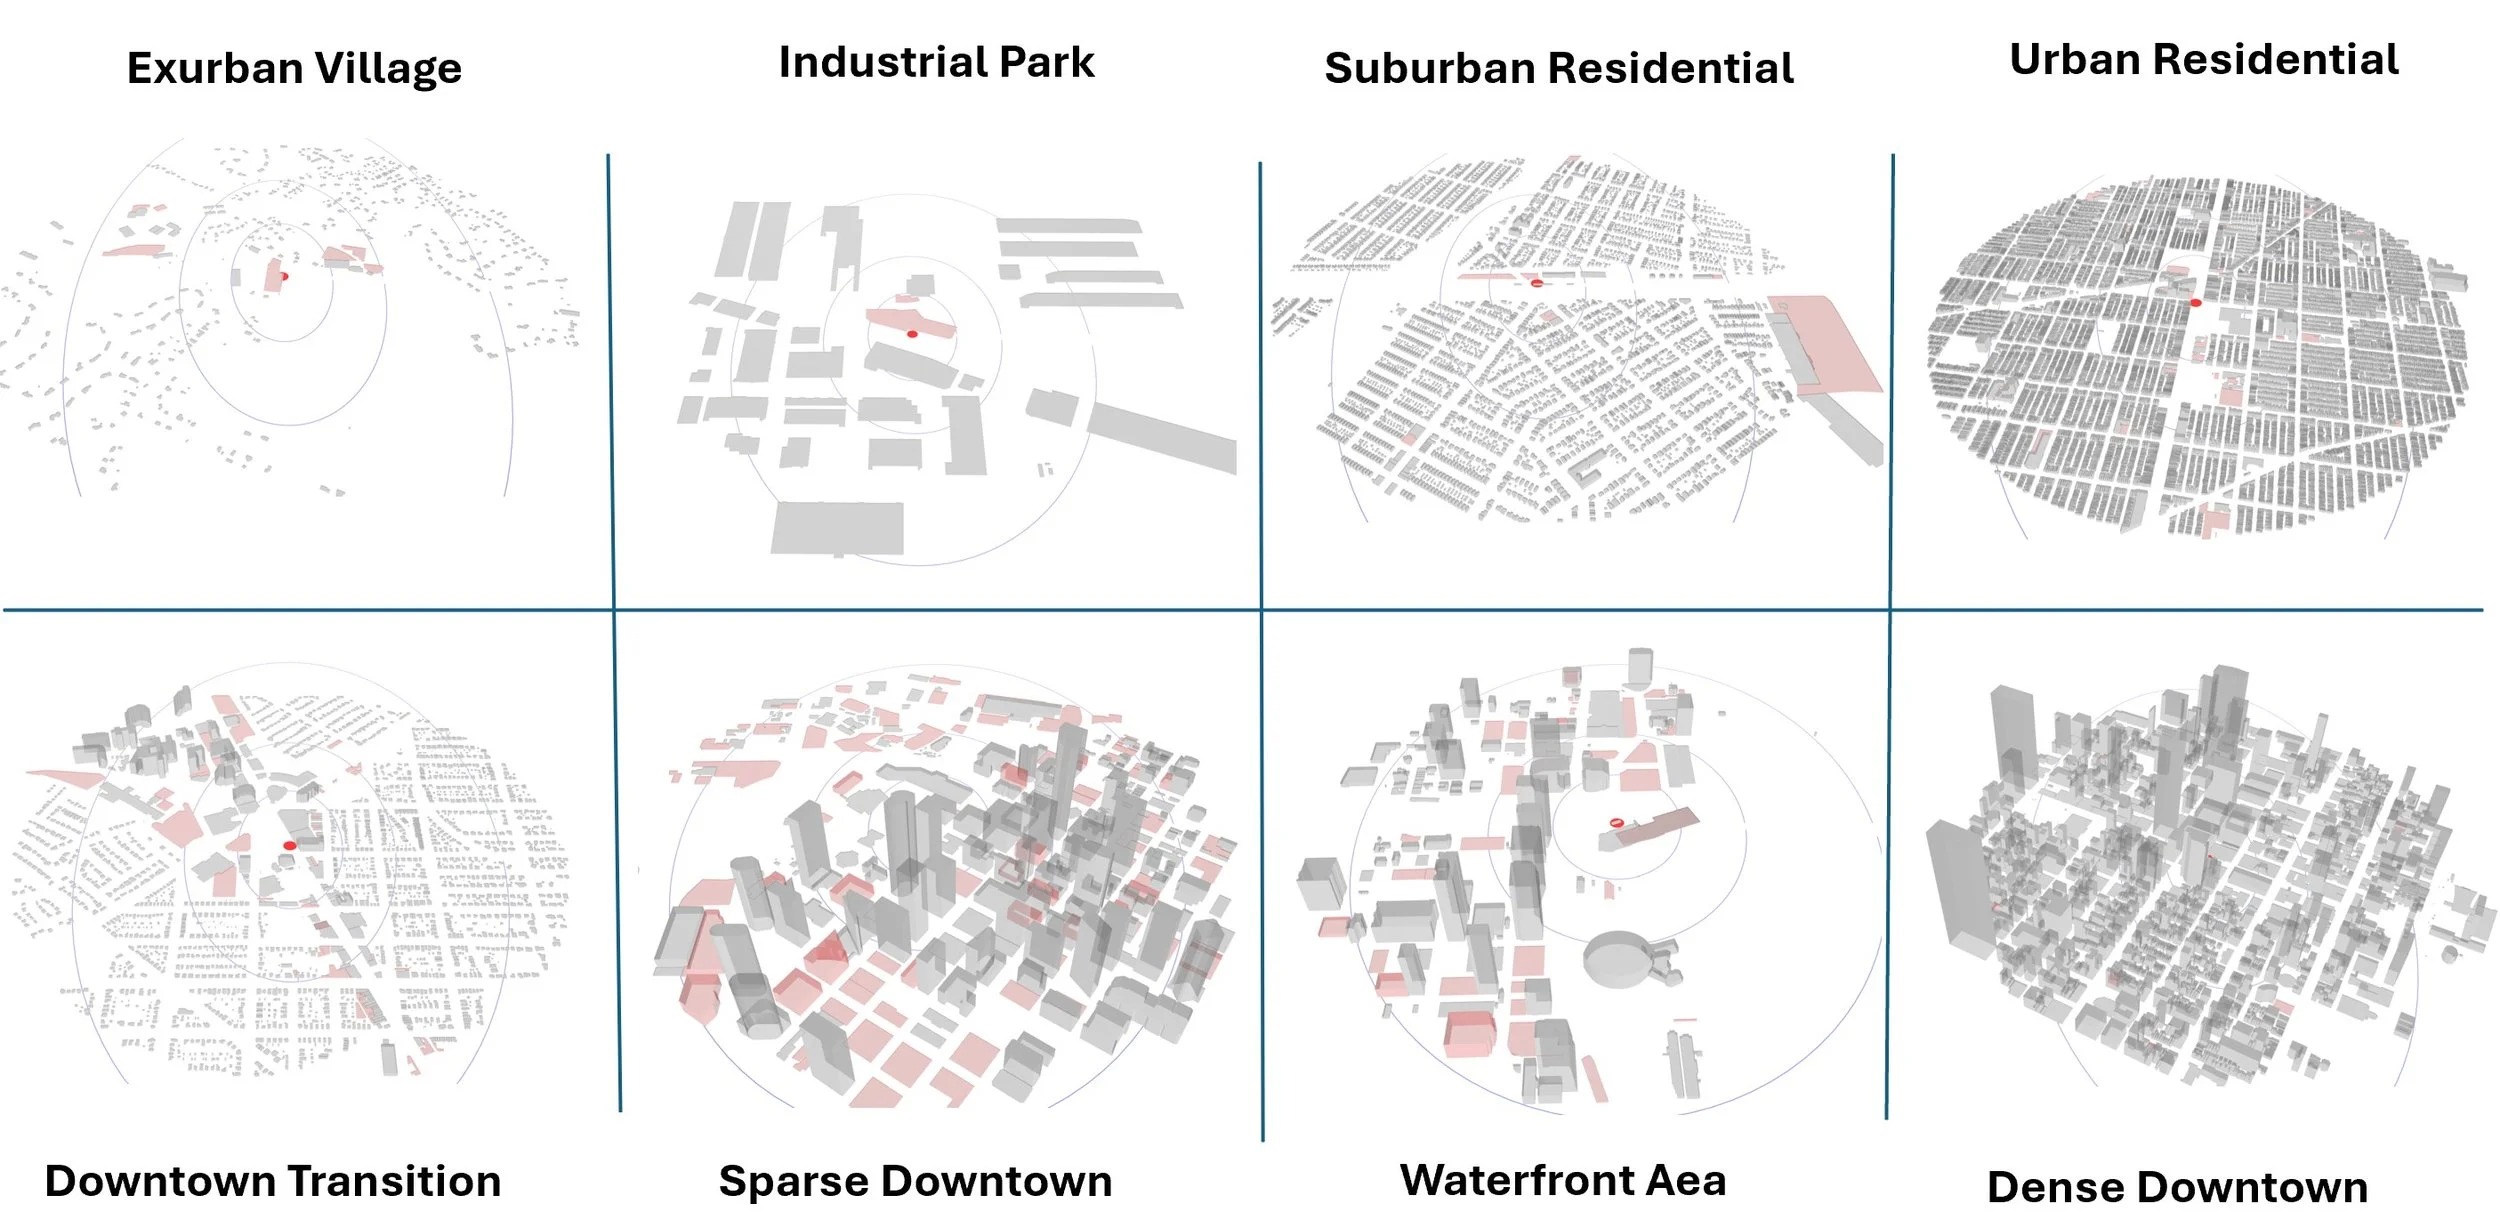
Armed with the data, typologies, and analysis, we named and summarized each station area category, highlighting the types of development best suited for each environment and noting each area’s opportunities and challenges. The image on the left identifies a 1/2 mile radius around each station using the OSM basemap and the one on the right provides a 3-D rendering of development around the station, including surface parking lots and parking garages, shaded in pink. The blue circles approximate a 200 meter, 400 meter, and 800 meter radius around the station.
Type 1: Exurban Villages
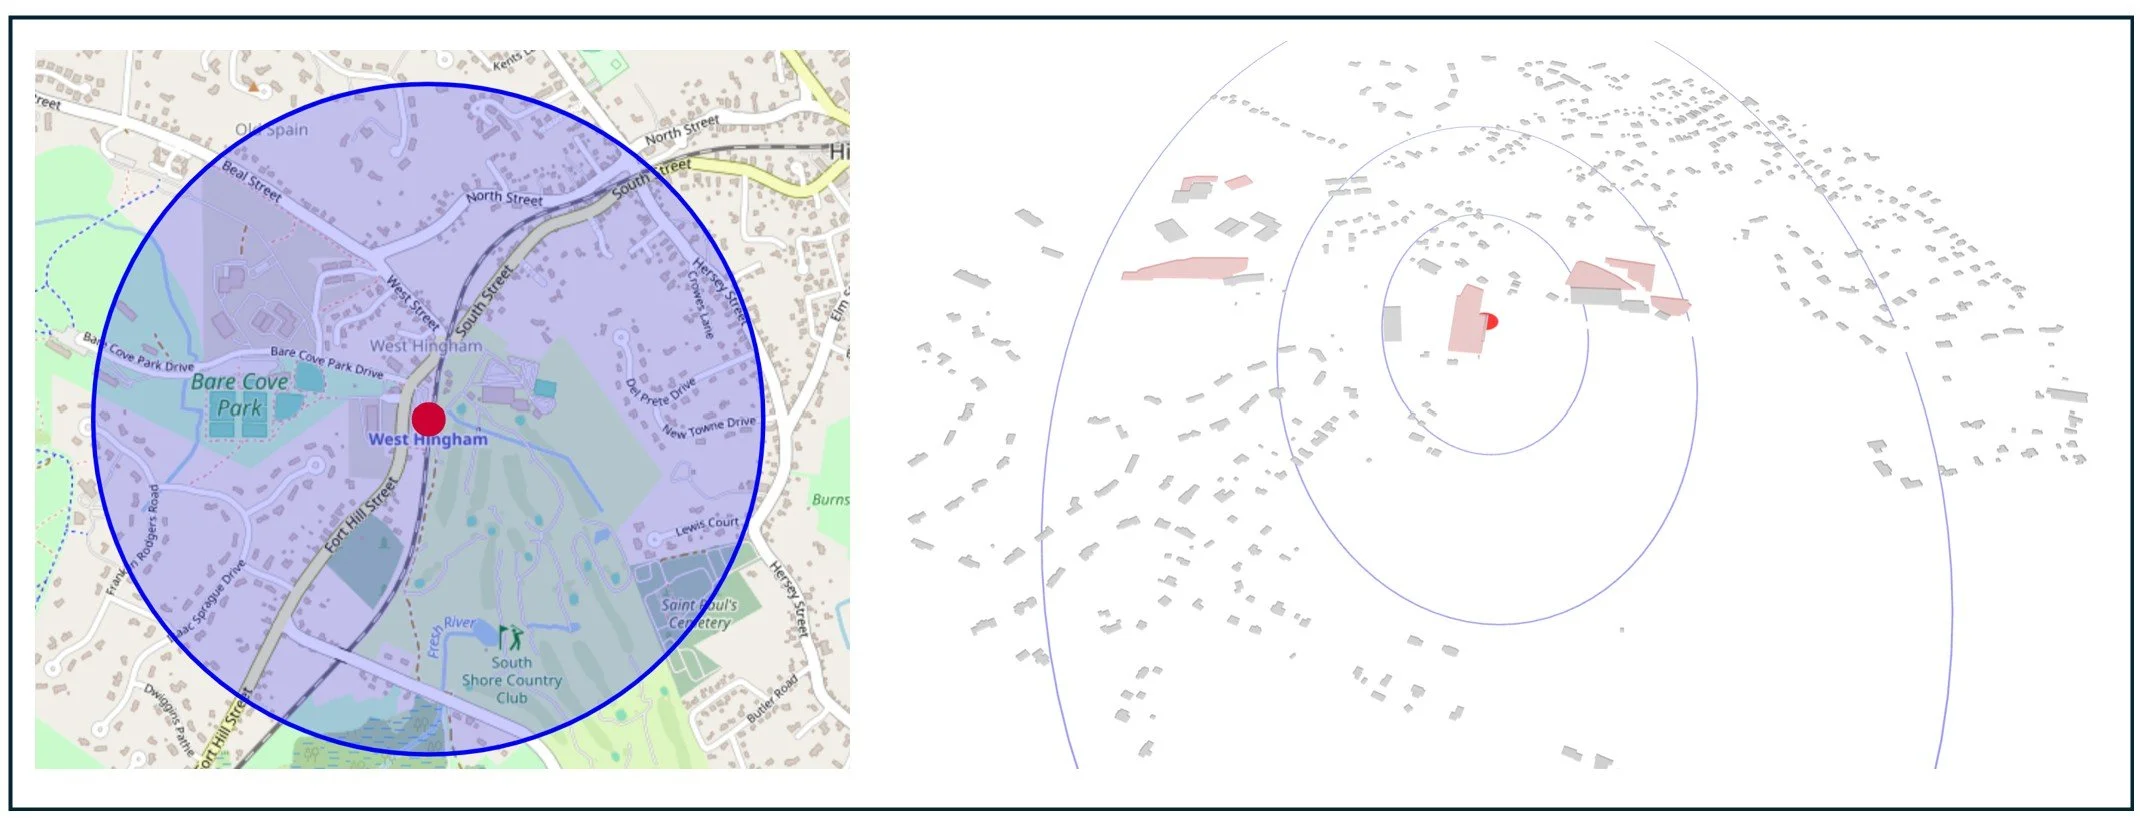
The West Hingham, MA Commuter Rail Station on the Massachusetts Bay Transportation Authority (MBTA) Greenbush Line is surrounded by 506 buildings (lower than the national average) occupying 83,077 square feet (lower than the national average) and an average building height of one story (lower than the national average).
Exurban village station areas consist of single-family homes, often on large lots and nearby natural areas or vacant land. Exurban villages account for almost one out of every four station areas in the United States (with the caveat mentioned earlier that they include some under-mapped stations that would likely be in other categories if all building data was added to OSM). This station type isn’t always located in the exurbs-many can be found throughout a metropolitan region-but they are more often than not located along commuter rail lines. Commuter rail comprises 27% of all transit stations in the United States but serves 52% of all exurban village stations. Many exurban village areas can be found along the MBTA commuter rail in Massachusetts as well as the Metro North and New Jersey Transit lines in New York and New Jersey and the SEPTA commuter rail in Pennsylvania.
Although exurban stations are not likely good candidates for high rises, they offer opportunities for additional housing. Many of these stations are adjacent to publicly owned commuter parking lots, a portion of which could be repatriated for housing, especially with commuter rail ridership on the decline. Lower existing density means utilities and roads may have the capacity for modest intensification, and proximity to natural areas can attract residents looking for a small town feel but with transit access to downtown.
On the other hand, local zoning may restrict anything beyond single-family homes, limited walkable amenities mean new residents would still need cars for daily needs, and commuter rail’s infrequent schedule and sometimes long trip times might reduce the appeal of living near transit.
Development strategies that fit with exurban stations include gentle densification, starting with accessory dwelling units (ADUs) and small-scale missing middle housing like duplexes, triplexes, and small apartment buildings that fit within the residential scale. Planners could prioritize stations with the most frequent service for initial investment and ultimately work towards mixed-use village centers near stations with essential services (grocery, pharmacy, café) to reduce car dependence. Officials could also investigate land banking around the most promising stations for future development as transit service improves.
Type 2: Industrial and Business Parks

The East Ontario, CA Commuter Rail Station on the Metrolink Riverside Line is surrounded by 35 buildings (lower than the national average) occupying 883,222 square meters (higher than the national average) and an average height of one story (lower than the national average).
Industrial and business park station areas are populated by a handful of large, low-slung buildings typically used for manufacturing, warehousing, logistics, or big box retail. There are only 89 station areas in this category (less than 2% of all stations). These stations tend to be located on the fringes of a metropolitan are in the southwest, Midwest, and southern California.
Industrial and business parks may include large development sites with big buildings and parcels that offer redevelopment potential with fewer assembly challenges. They offer an opportunity to add housing near existing employment centers, some adaptive reuse potential, and less community resistance because fewer nearby residents may mean less opposition to transformative change.
However, these sites are challenging to redevelop. Obstacles include existing air, water, and noise pollution, environmental remediation required to clean up soil and groundwater, limited amenities, poor pedestrian infrastructure, and industrial zoning which prohibits residential use entirely.
While many of these sites may never be good candidates for transformation, a comprehensive master planning strategy could eventually transform these areas into mixed-use districts over time. This strategy could focus on hybrid development that maintains some industrial/flex space while adding housing and amenities, creating innovation districts that blend light industrial, creative office, and residential uses and using form-based zoning that allows flexible uses within appropriate building types.
Type 3: Suburban Residential
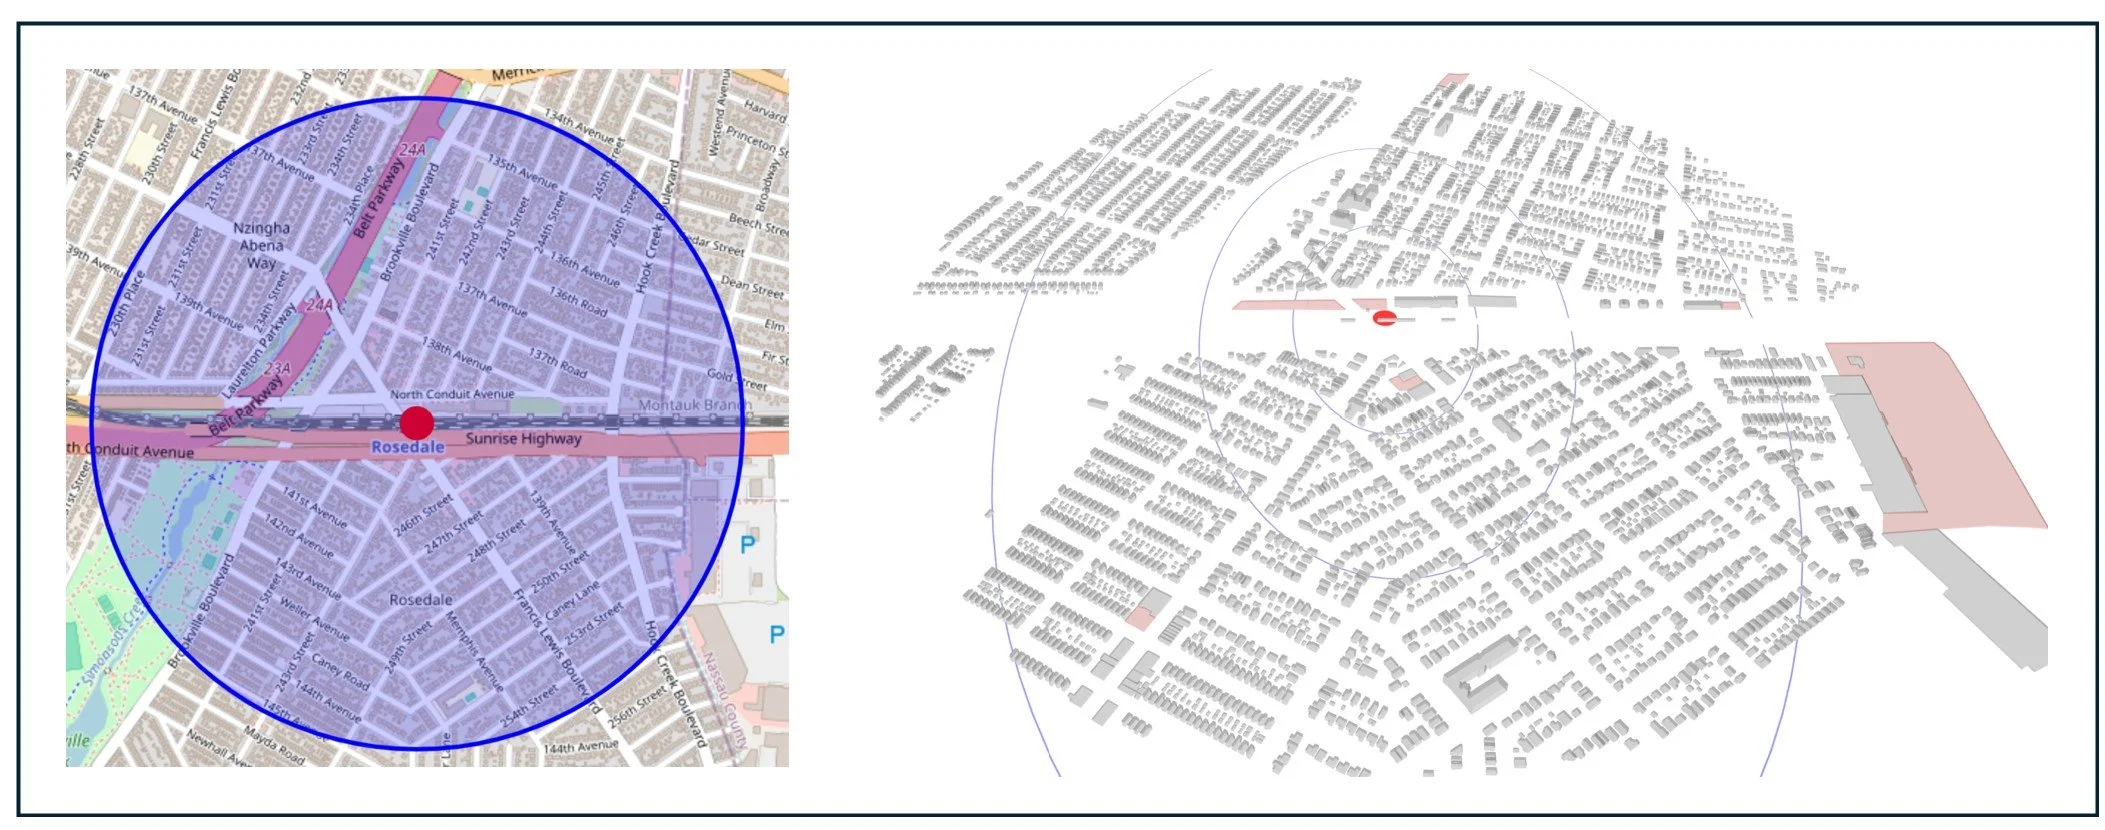
The Rosedale, NY Commuter Rail Station on the Long Island Railroad’s Long Beach Branch and Far Rockaway Branch lines is surrounded by 4668 buildings (higher than the national average) occupying 378,907 square meters (lower than the national average) and an average height of 1 story (lower than the national average).
Suburban residential station areas feature relatively small, single-family homes clustered on small lots. This group includes 520 stations or close to 12% of all station areas. As with exurban village stations, these areas are most likely to be served by commuter rail, with 46% of all suburban residential stations on a commuter rail line. They are often found in the Boston, New York, and Philadelphia suburbs.
This station area type includes existing community infrastructure (such as schools, parks, and playgrounds) and many areas have strong housing demand that can support modest density increases. Clustered homes on smaller lots offer shorter walking distances to stations and neighborhood services, and small lots with single-family homes create good conditions for missing middle housing that fits the neighborhood scale.
However, change in these neighborhoods can often run into community resistance with residents voicing opposition over parking expectations, school capacity, and infrastructure complaints. This opposition combined with existing single-family zoning can make it difficult to build additional housing or commercial space.
An optimal development strategy here would be contextual densification that works within existing neighborhood patterns. Advocates can prioritize missing middle housing and zoning reform to allow duplexes and ADUs by-right in single-family zones. Planners and developers can target strategic sites like oversized lots, corner properties, and areas near commercial strips for small-scale multifamily development and create design guidelines that ensure new housing complements existing architectural styles and lot patterns.
Type 4: Urban Residential

The Snyder, PA heavy rail station on the Southeastern Pennsylvania Transportation Authority (SEPTA) Broad Street Line is surrounded by 13,117 buildings (higher than the national average) occupying 994,913 square meters (higher than the national average) with an average height of 3 stories (lower than the national average).
Urban residential station areas include dense single-family homes, row houses, and small apartments packed together near a station, often inside the city limits of places like New York, Chicago, San Francisco, Los Angeles, New Orleans, and Philadelphia. There are 721 stations in this category or about 15% of all station areas. About 30% of these station areas are served by light rail systems, 26% are served by commuter rail and the rest served by other transit modes.
The dense housing stock walkable street grids, and established amenities in urban residential areas creates a supportive environment for additional infill and intensification. Other advantages include closer proximity to the urban core and to high frequency transit service as well as strong market demand that can command premiums prices. Small vacant lots, surface parking, and aging buildings offer infill opportunities.
However, development in urban residential areas comes with its own challenges, including small lot sizes that make assembling development sites difficult and expensive, older urban infrastructure, parking conflicts, and concerns about gentrification and displacement of existing residents and businesses. Developing in older, more urban areas may involve additional regulatory complexity with multiple zoning districts, historic preservation requirements, and design reviews.
A viable development strategy for these areas could be called strategic infill that focuses on small-scale intensification through conversions of single-family homes to multi-unit buildings, modest apartment buildings on corner lots, and rooftop additions, using adaptive reuse to convert underutilized commercial or institutional buildings to housing, and missing middle zoning that allows 3-4 story buildings consistent with rowhouse neighborhoods. Planners could also consider land value capture mechanisms to fund affordable housing and infrastructure improvements needed to support additional density.
Type 5: Downtown Transition Areas
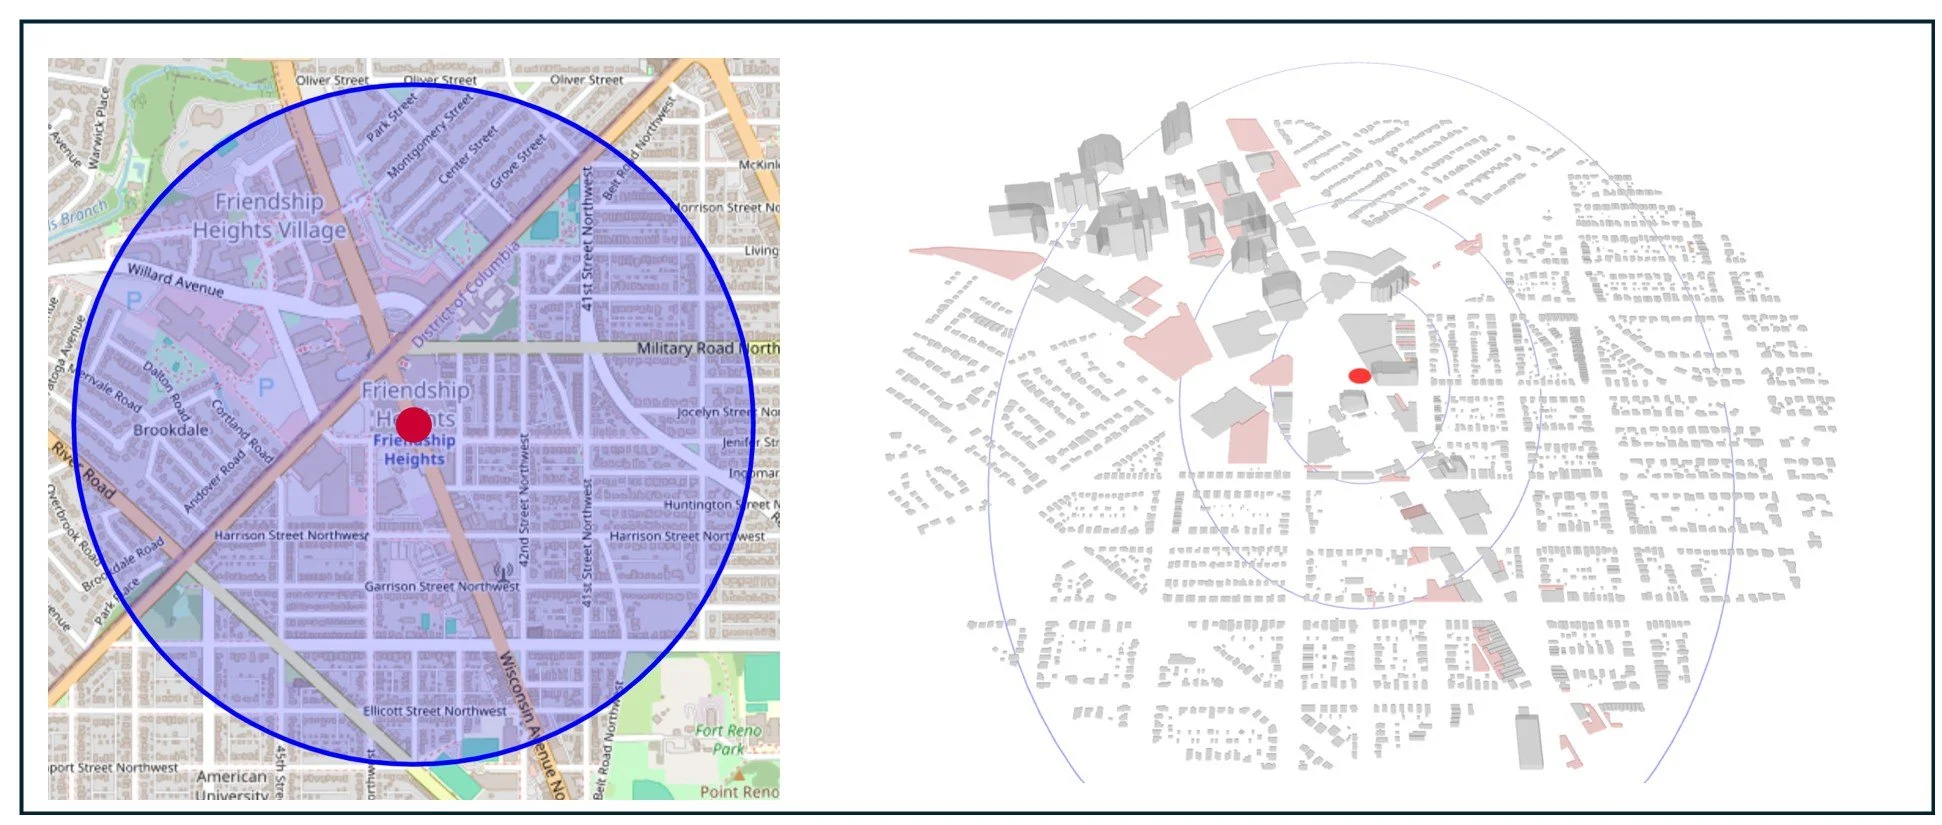
The Friendship Heights, MD heavy rail station on the Washington Metropolitan Area Transit Authority (WMATA) red line is surrounded by 2,356 buildings (higher than the national average) occupying 396,284 square meters (lower than the national average) with an average height of 9 stories (higher than the national average).
Downtown Transition areas combine of taller and more massive buildings typical of a downtown core with residential development more often found in an urban residential or suburban residential area. There are not very many of these areas (only 250 out of almost 5,000 nationwide) and are served by a mixture of light rail, heavy rail, and commuter rail.
It’s likely that these station areas started out as subrban residential or urban residential areas and have intensified over time. The mix of building types indicates active development market with proven feasibility for various scales. A downtown core means jobs, services, and cultural amenities already exist within walking distance. The area’s mixed housing character suggests more permissive zoning, and a successful mix of uses demonstrates sustained demand for urban living and investment.
Challenges include friction between downtown-scale development and nearby residential neighborhoods. In addition, new development must navigate appropriately between different neighborhood characters, and strong downtown markets can displace existing affordable housing.
In light of these advantages and challenges, a development strategy that uses gradual transition zoning can creates smooth height and density transitions from downtown core to residential areas. Planners can also focus on mixed-use development that combines residential with ground-floor retail or office space appropriate to each micro-area and prioritize adaptive reuse of older downtown buildings for housing while allowing new construction to fill gaps.
Type 6: Sparse Downtowns

The Theater District (TX) Light Rail Station on the Houston Metro Green Line is surrounded by 295 buildings (lower than the national average) occupying 579,279 square feet (higher than the national average) with an average height of 28 stories (higher than the national aveerage).
Sparse downtown station areas consist of a relatively small number of residential or commercial buildings with large footprints and high heights. There are 721 stations in this category or about 15% of all stations. Sparse downtown areas can be found in central business districts across the United States where a transit station area includes a highway or parking structures instead of dense residential or commercial uses. These station areas tend to be served by light rail and streetcar rail systems. (Streetcar stations represent 10% of all stations in the United States but 26% of stations in sparse downtowns). Houston, New Orleans, Atlanta, and Seattle all have relatively large numbers of stations in this category.
Unlike the suburban residential or urban residential types. sparse downtown station areas have relatively abundant developable land in the form of surface parking sites which offer opportunities without demolition. These areas also permit tall buildings enabling significant density increases, and they offer close access to existing offices and economic activity.
However, many of these areas have not been built with pedestrians in mind. Wide streets create hostile environments for foot traffic and highways impose barriers to walking even short distances. Insofar as these areas also lack walkable retail, restaurants, and services, they may be less attractive for new residents (though the presence of streetcar lines and stops may reflect some areas’ efforts to promote urban amenities. Large building footprints and parking lots create monotonous streetscapes lacking human scale, and the presence of parking instead of housing or offices may signal a weak market for new development.
Addressing these challenges could involve catalyst projects near the best transit stations to demonstrate market viability and create development momentum along with form-based zoning that requires active ground floors and human-scaled street frontages regardless of building height. Complete street redesigns can calm traffic and create walkable environments between stations and destinations and mixed-use requirements that combine housing with retail and office can lead to 18-hour neighborhoods like the ones described here.
Type 7: Downtown Waterfronts

The Museum Park Maglev Station on the Miami-Dade Transit Metro Mover loop is surrounded by 159 buildings (lower than the national average) occupying 363,666 square meters (lower than the national average) with an average height of 28 stories (higher than the national average).
Stations in this category are surrounded by relatively few structures with small footprints and high heights. This development pattern can be for several reasons, including rules that allow for “supertall” residential buildings or office towers surrounded by landscaping or parking lots. This form also exists near transit stations in downtowns near a body of water. An adjacent lake, harbor, or ocean provides a natural limit to the number of buildings and their overall building footprint, but the city’s zoning and demand for housing and offices allow structures that can be built to be very tall. Many ferry stations as well as waterfront stations in Miami, New York, New Jersey, and San Francisco fall into this category. Also included are station areas near other natural features hat limit development such as Manhattan’s Central Park. There are 514 stations of this type (less than 10% of all stations).
Downtown Waterfront Areas occupy high-value real estate whose water views and recreational opportunities are highly desirable. Zoning for tall buildings maximizes development potential on the limited developable land and the areas are located near many amenities and points of interest, encouraging active transportation to nearby destinations.
However, these areas also come with significant challenges with climate change risk first and foremost. Building near water also can require specialized engineering and higher construction costs and multiple agencies (local, state, and federal) regular waterfront development, creating approval complexity.
Given the ongoing risks of flooding, storm surges, and other extreme weather scenarios, it may not make sense to encourage additional development in these areas at all (which is why Chakrabarti’s analysis excludes these areas). However, if development is planned, it can incorporate flood protection and sea level rise adaptation from the design phase. Equitable development could also use waterfront public access requirements that ensure new development enhances rather than blocks public enjoyment of water resources and create ferry-transit integration that seamlessly connects water-based and land-based transportation.
Type 8: Dense Downtowns
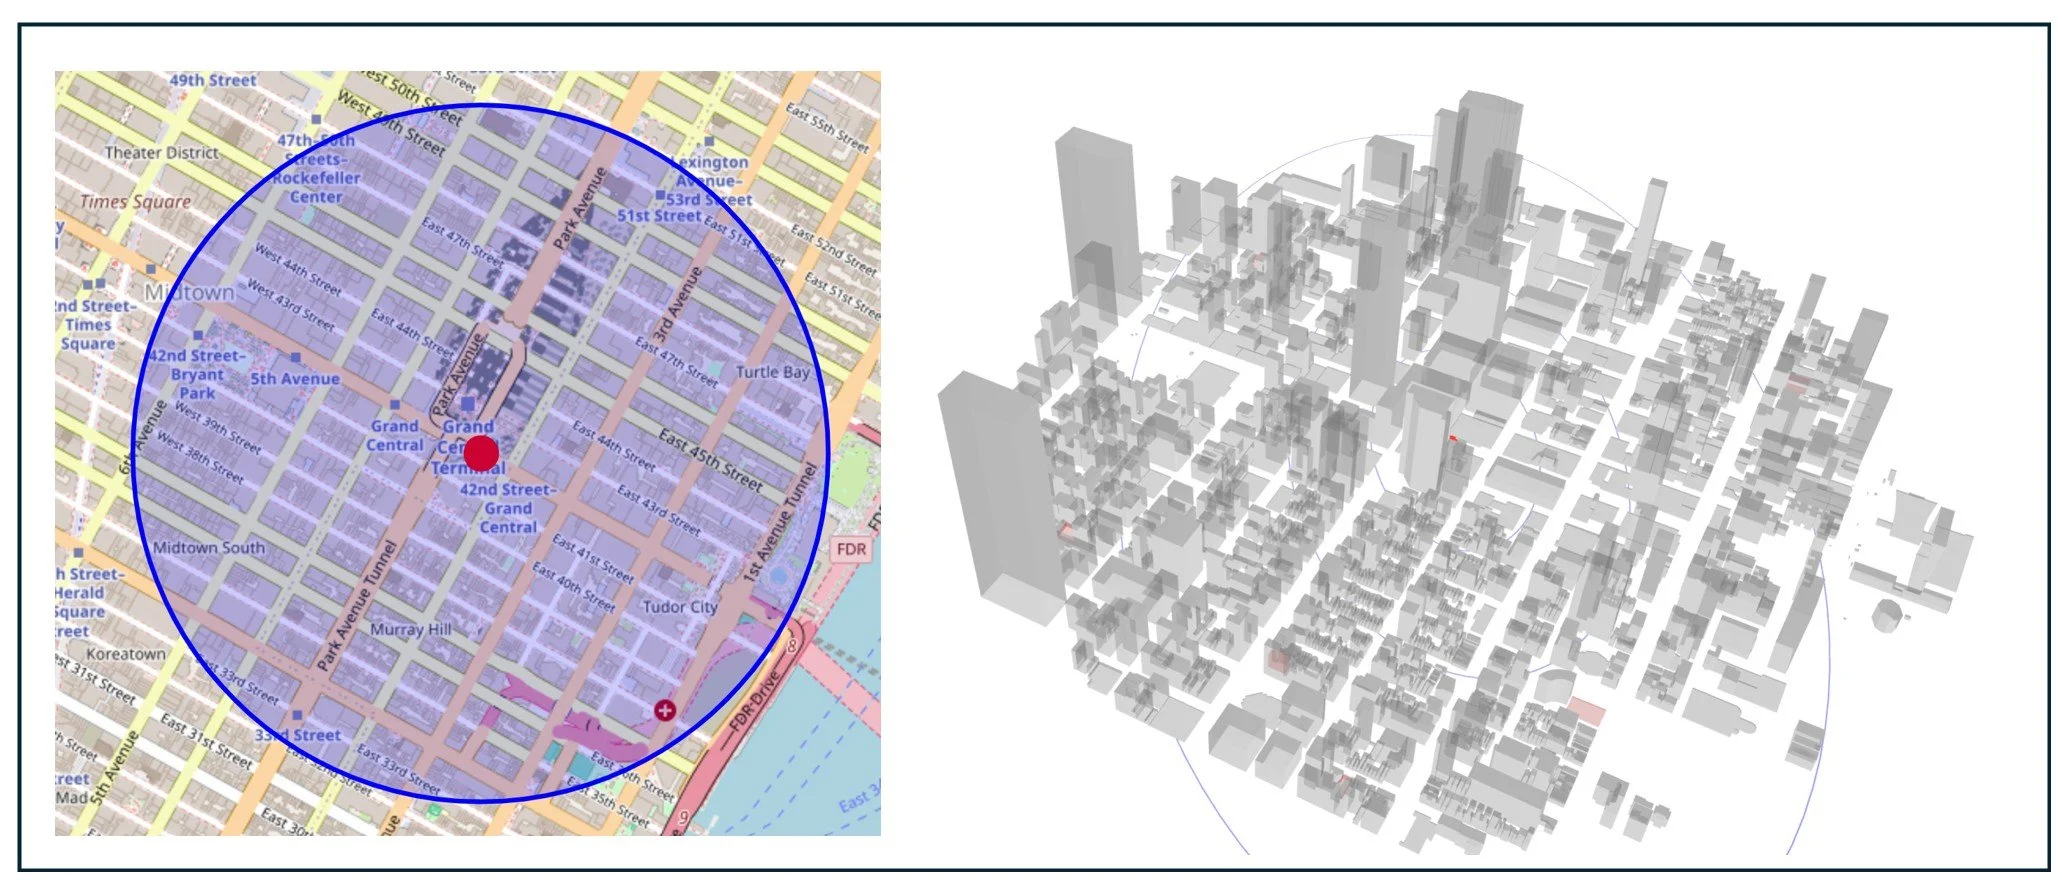
The Grand Central Station served by multiple Metropolitan Transit Authority (MTA) heavy rail and commuiter rail lines is surrounded by 1624 buildings (higher than the national average) occupying 1,158,824 square meter with an average height of 30 stories.s
Last but not least are dense downtown areas: stations surrounded by large numbers of buildings with large footprints and high heights. Almost 20% of all stations in the United States (992 stations) are in this category and half are served by heavy rail. Dense Downtown station areas exist in large cities around the country and in New York City, in particular (about a quarter of all stations in this category are served by New York City Transit and half of the stations in New York City are dense downtowns).
There’s a reason that people live and work in these areas and why additional development can be attractive: Heavy rail systems provide frequent, high-capacity service ideal for car-free living and maximum density. Concentration of jobs, services, and amenities create economic efficiencies. Multiple transit lines improve accessibility, and the existing zoning allows for adding significant numbers of new housing units.
However, high property values make affordable housing development financially challenging without subsidies. The commercial real estate market has not yet recovered from the COVID-19 pandemic in many areas. There is very little vacant land or areas that don’t require demolition or renovation and building in dense areas creates complex staging, access, and complaints and challenges from neighbors., Multiple layers of zoning, historic preservation, and design review create lengthy approval processes.
Relevant strategies here include adaptive reuse of older office buildings for housing, taking advantage of changing work patterns and office space demand and using air rights development over transit infrastructure, parking facilities, and low-rise buildings to add density without displacement. Strategies also include using value capture financing to fund infrastructure improvements needed to support additional density while ensuring existing residents benefit from neighborhood investment.
From Archetypes to Apartments: A Data Driven Housing Strategy
The housing crisis gripping many American cities demands solutions that are both ambitious in scale and sensitive to local context. By extending Chakrabarti's methodology from New York's five boroughs to nearly 5,000 transit stations across the entire United States, we've demonstrated that data-driven analysis can reveal development opportunities while respecting neighborhood character. Our eight transit station typologies provide a roadmap for context-appropriate housing strategies—from gentle densification in exurban villages to strategic infill in urban residential areas to adaptive reuse in sparse downtowns. The digital surveyor approach democratizes urban analysis, making it possible for planners, policymakers, and communities to understand their development potential without the traditional barriers of time and cost. Most importantly, this framework proves that we don't need to choose between preserving community character and addressing housing affordability. With the right analytical tools and typological understanding, America's transit networks can become the backbone of a more equitable and sustainable housing future—one that builds up thoughtfully rather than sprawling out endlessly, creating vibrant, walkable communities where both longtime residents and newcomers can thrive.
David Schneider is the founder of Transit-Oriented Discoveries, which provides data and analytical tools for people working to create better places to live and work near transit stations. You can reach him at connect@transitdiscoveries.com. Kaisar Hossain is pursuing a master’s degree in computer science with a specialization in AI, machine learning, and data analytics at the Catholic University of America School of Engineering. He developed the exploratory data analysis and descriptive statistics for this post. You can reach him at kaisar.hossain@gmail.com or via LinkedIn.