The Long Game Stoppage Time: How the Eleven US World Cup Host Cities Actually Performed
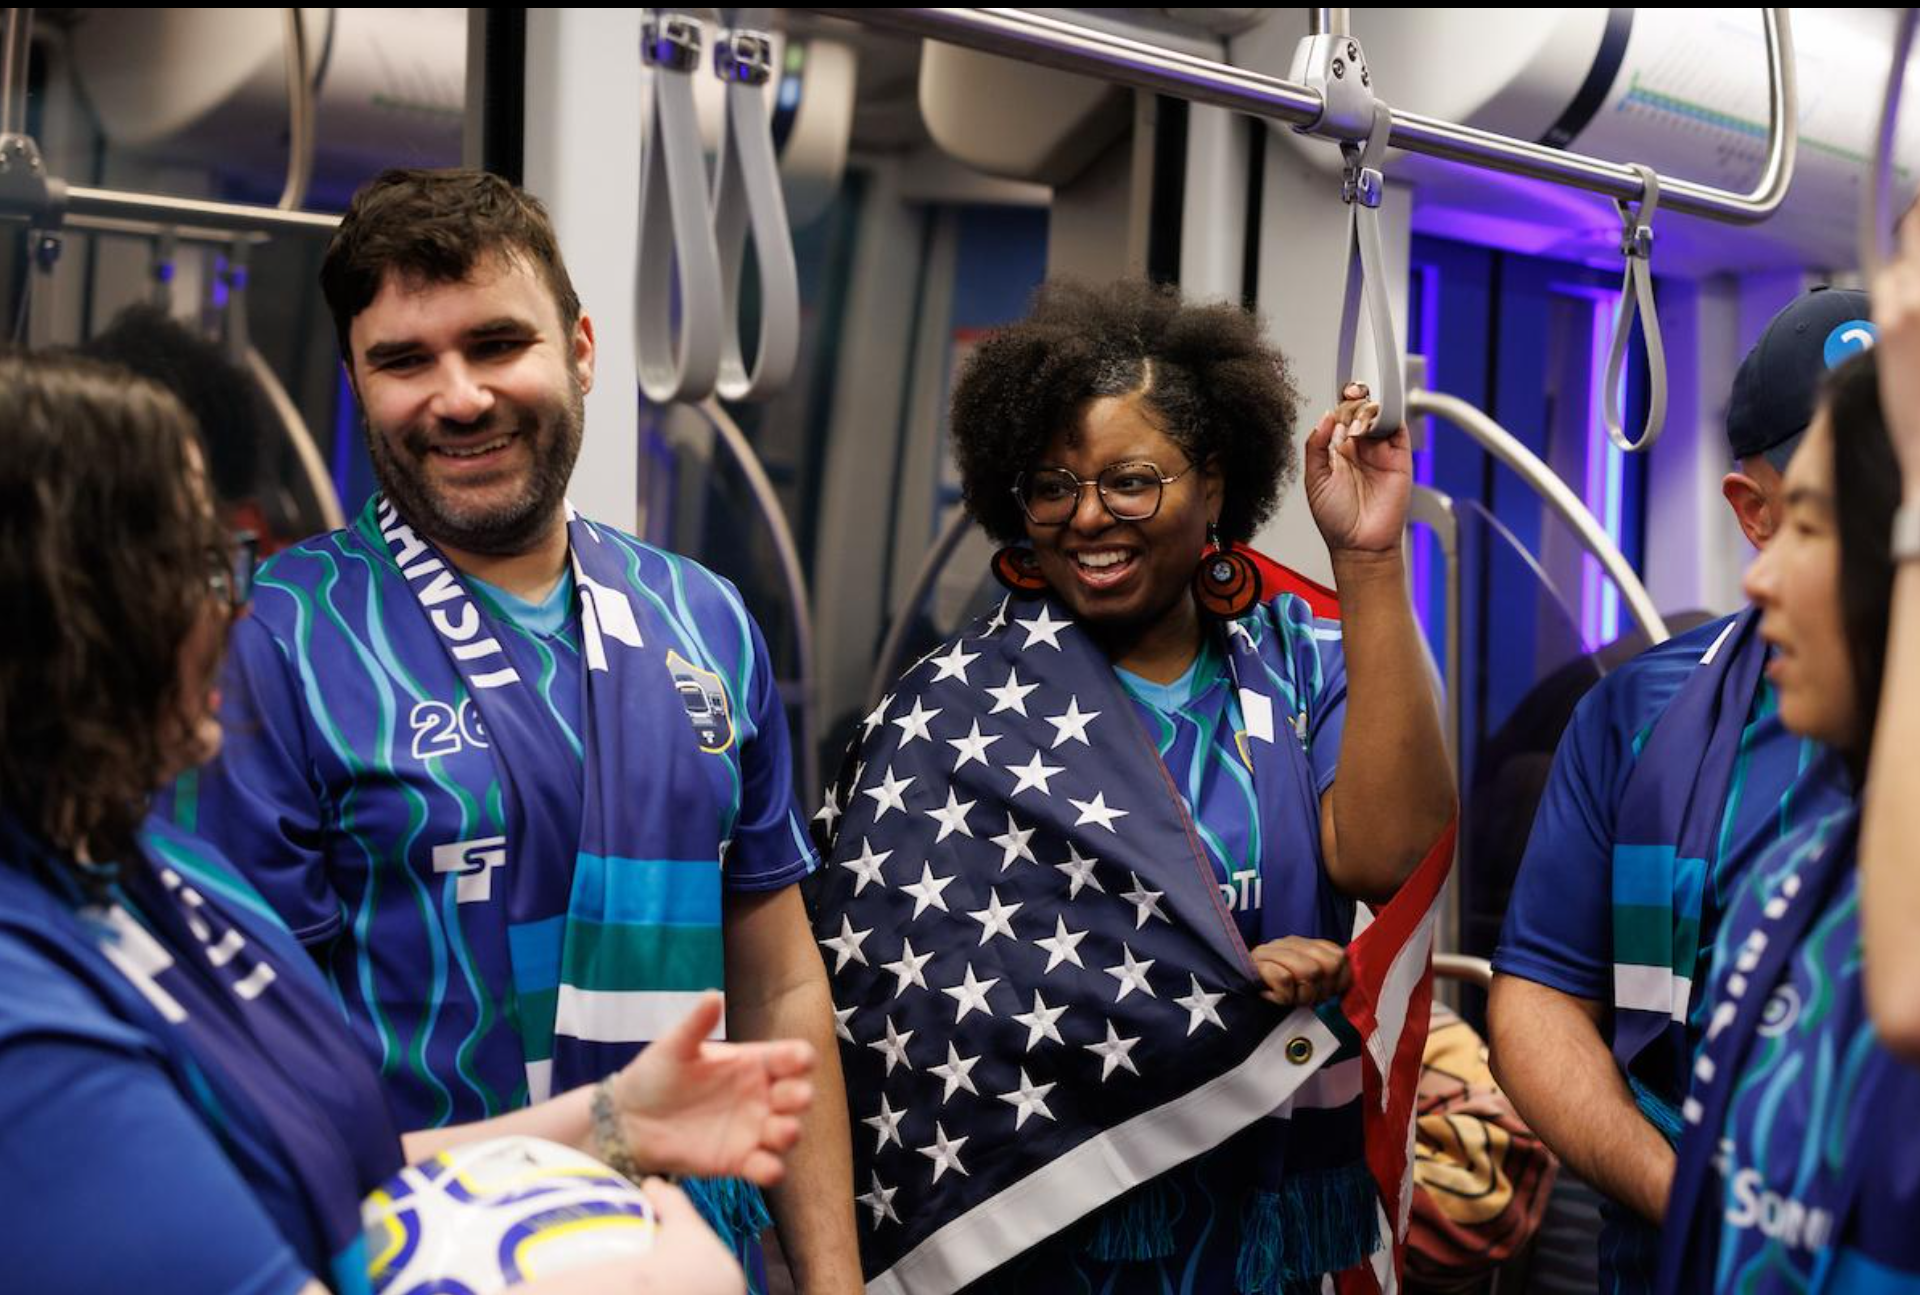
World Cup fans on Link Light Rail. Source: Sound Transit
It's August, and NFL training camps are up and running. Soon the eleven United States stadiums that hosted the biggest sporting event in the world will revert to the business of American football for which they were built. Before we pivot to gridiron headlines and back-to-school pictures, let’s take one last look back at what the World Cup can teach us about urbanism in America.
My prior post, The Long Game: What the World Cup Says About American Cities,treated this summer’s World Cup as a natural experiment shining a spotlight on urban planning and political decisions that shaped the experience of fans and residents alike. That post ranked each city on how well its transportation infrastructure, demand management choices, and surrounding urban fabric will serve fans, residents, regular transit users, and taxpayers this summer.
This post revises my rankings to incorporate how each host performed during the tournament, rewarding both preexisting infrastructure and historical smart planning decisions as well as operational execution. My new rankings consider whether or not transit ridership exceeded expectations, the extent to which cities were able to improve car-free mobility for trips other than fans traveling to and from the stadium, and the experience for locals as well as visitors.
But before evaluating any city, I’d like to congratulate all eleven host cities on their remarkable achievements. I don’t believe there was a major operational failure anywhere during the World Cup and, just as importantly, the joy amongst people experiencing the games in the host cities was palpable.
I envied the scenes of World Cup fun from afar in in Washington DC, a city passed over for the games but second to none when it came to our nation’s politicized and mediocre 250th birthday bash. Instead of enjoying the roar of the crowd, we suffered the noise of too many military jet flyovers. Instead of hosting bustling fan festivals, we made due with a sparsely attended American State Fair. Instead of watching players scramble across a soccer pitch, we observed algae bloom across a shoddily repaired reflecting pool. In stadiums, spectators rejoiced and despaired as their teams won and lost. On the National Mall, reflecting pool visitors were arrested and indicted on fabricated charges of vandalism. Honestly, any place was better than here.
But hope springs eternal for better days in DC and across the United States. In the meantime, now that the wildfire smoke has cleared and before it returns, let us take one last look at how the cities performed and what lessons we can learn from them.
# 1 Seattle (Previous Rank: #1) “Almost as Busy as BART”
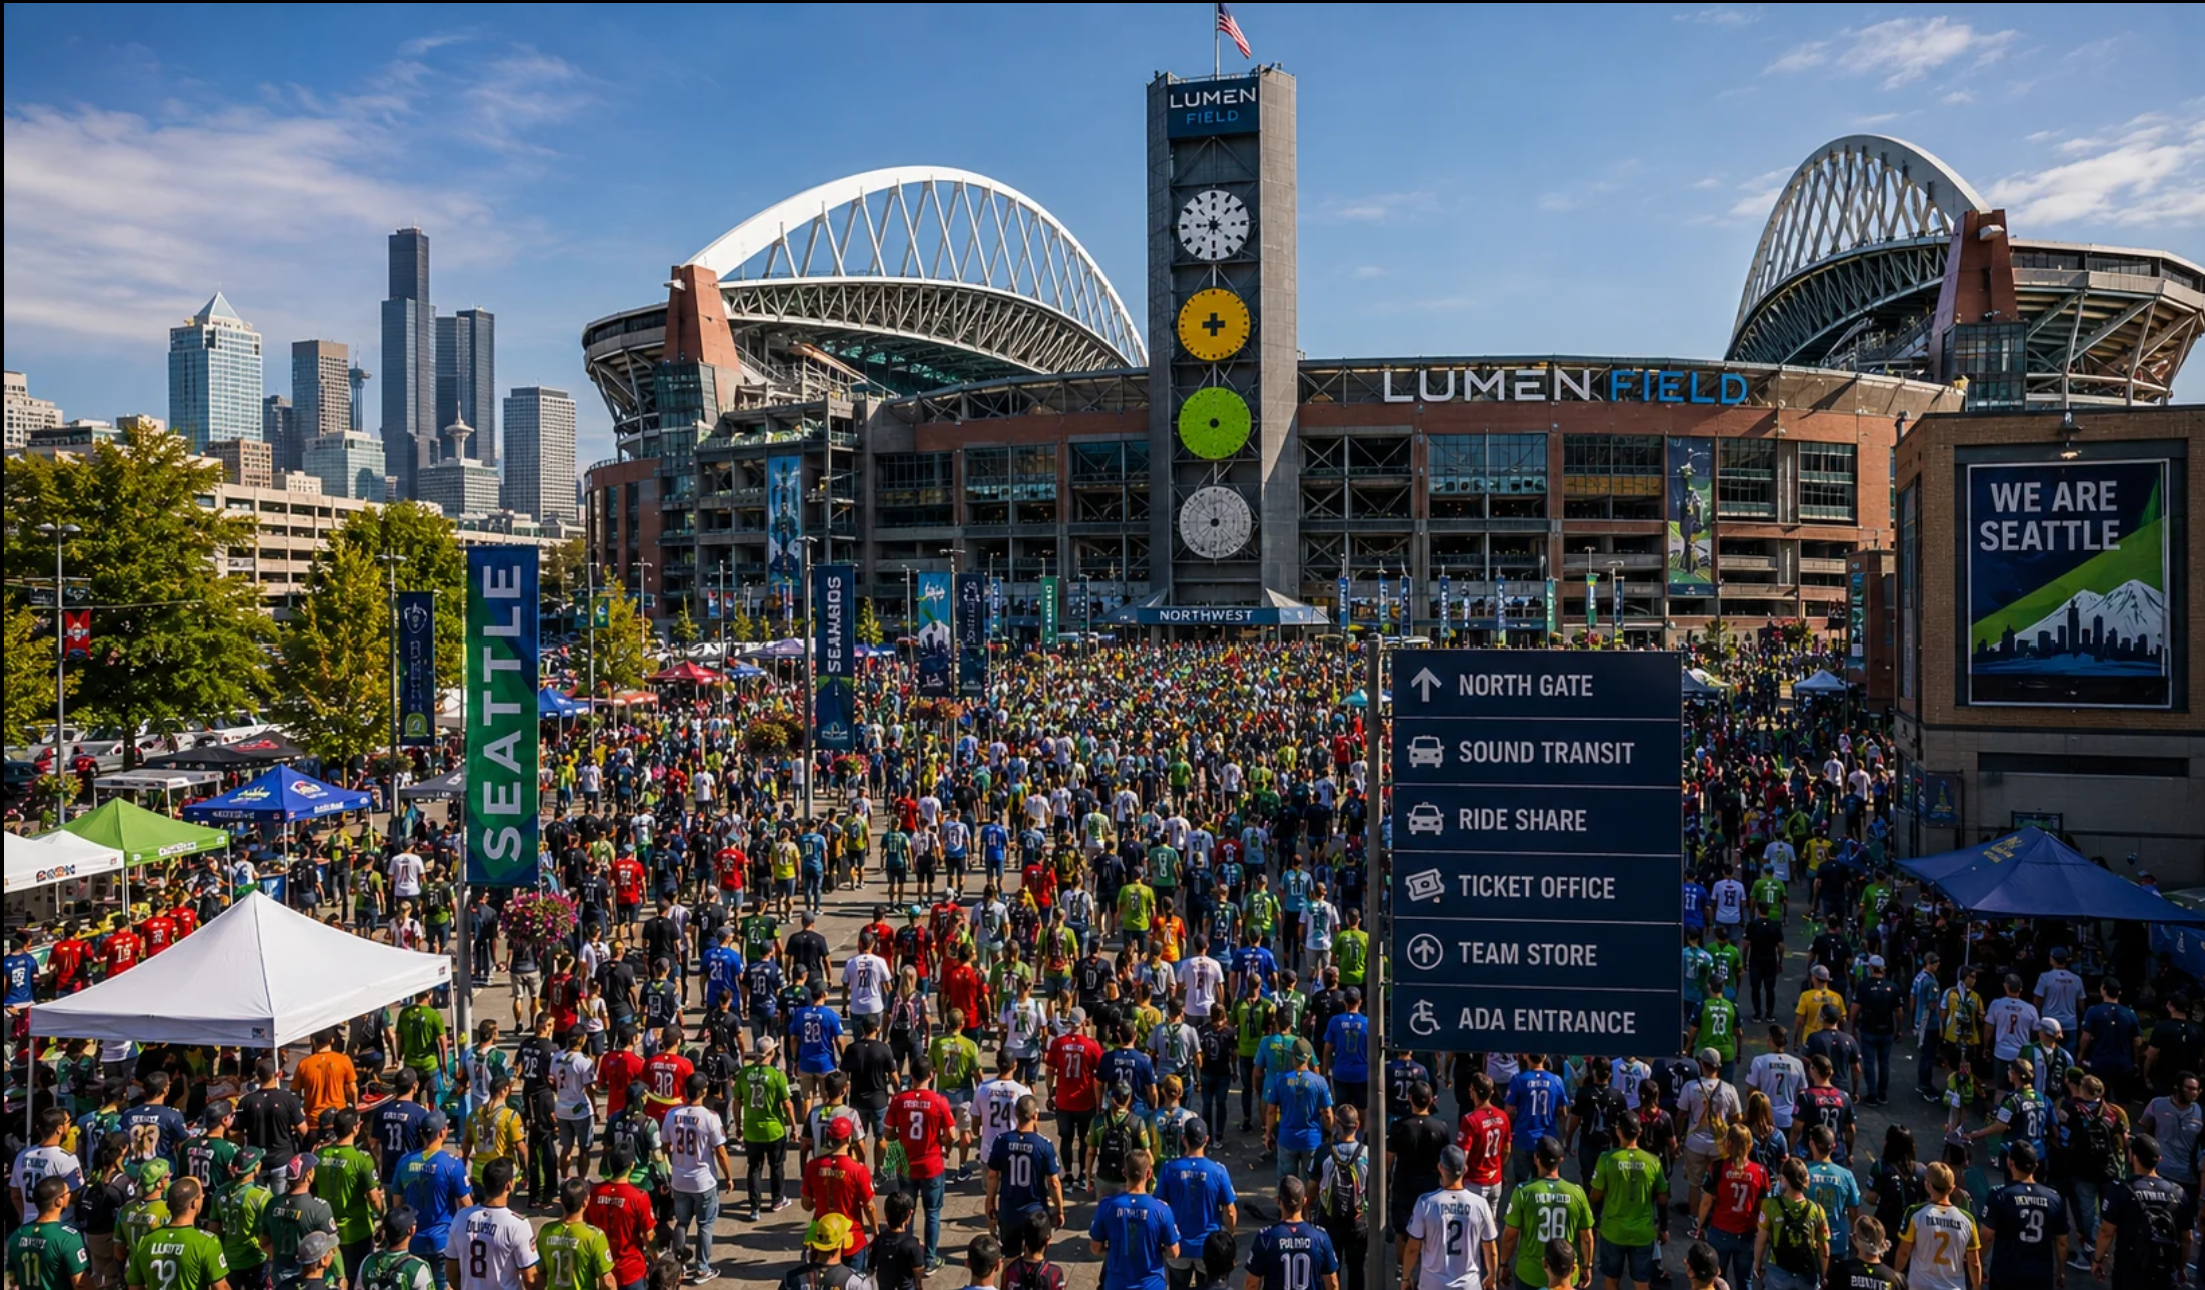
Fans arrive at Lumen Field. Source: Fido
Seattle entered the World Cup season ranked #1 thanks to stadium located a few minutes from downtown, surrounded by multiple transit stations and a dense, walkable street grid and plans for increased transit service and improved pedestrian infrastructure.
The city was poised to pull off the most car-free World Cup of any host city and, in the end, it did not disappoint. It’s Link light rail hit 5.4 million boardings in June (a monthly record) and broke two single-day records: 280,000 boardings June 19 (US-Australia + a sold-out Mariners game + Juneteenth), then 309,000 boardings July 6 (US-Belgium Round of 16) blowing past the previous all-time record of 220,000 set during the Seahawks Super Bowl victory parade. As one commuter noted, the average June ridership of 180,000 people a day made the transit system “almost as busy as BART”
Fans took advantage of the city’s welcoming street network as well. International visitors adopted the city’s local “March to the Match” tradition of walking to the stadium. The single largest march of the tournament was USA vs. Australia which included 15,000 Americans and 8,000 Australians or one-third of the stadium size arriving on foot. One bystander observing marchers pass an intersection before the Bosnia & Herzegovina vs. Qatar match described it taking 15 minutes for the crowd to pass through.
Not everything went perfectly. Post-match crowd bottlenecks occurred at the International District/Chinatown Station, especially after the US-Belgium match where riders reported waits of 60-90+ minutes as thousands tried to board simultaneously; some gave up and took rideshare home at inflated prices. The City didn’t get a shot at redemption as July 6 was Seattle’s last match (and the end of the dream for the US team) but a single bad hour on its best-attended day shouldn't outweigh six great weeks in with a transit system and built environment that mostly did exactly what it was designed to do.
#2 Houston (Previous Rank: #3) They Had a Problem and They Fixed It
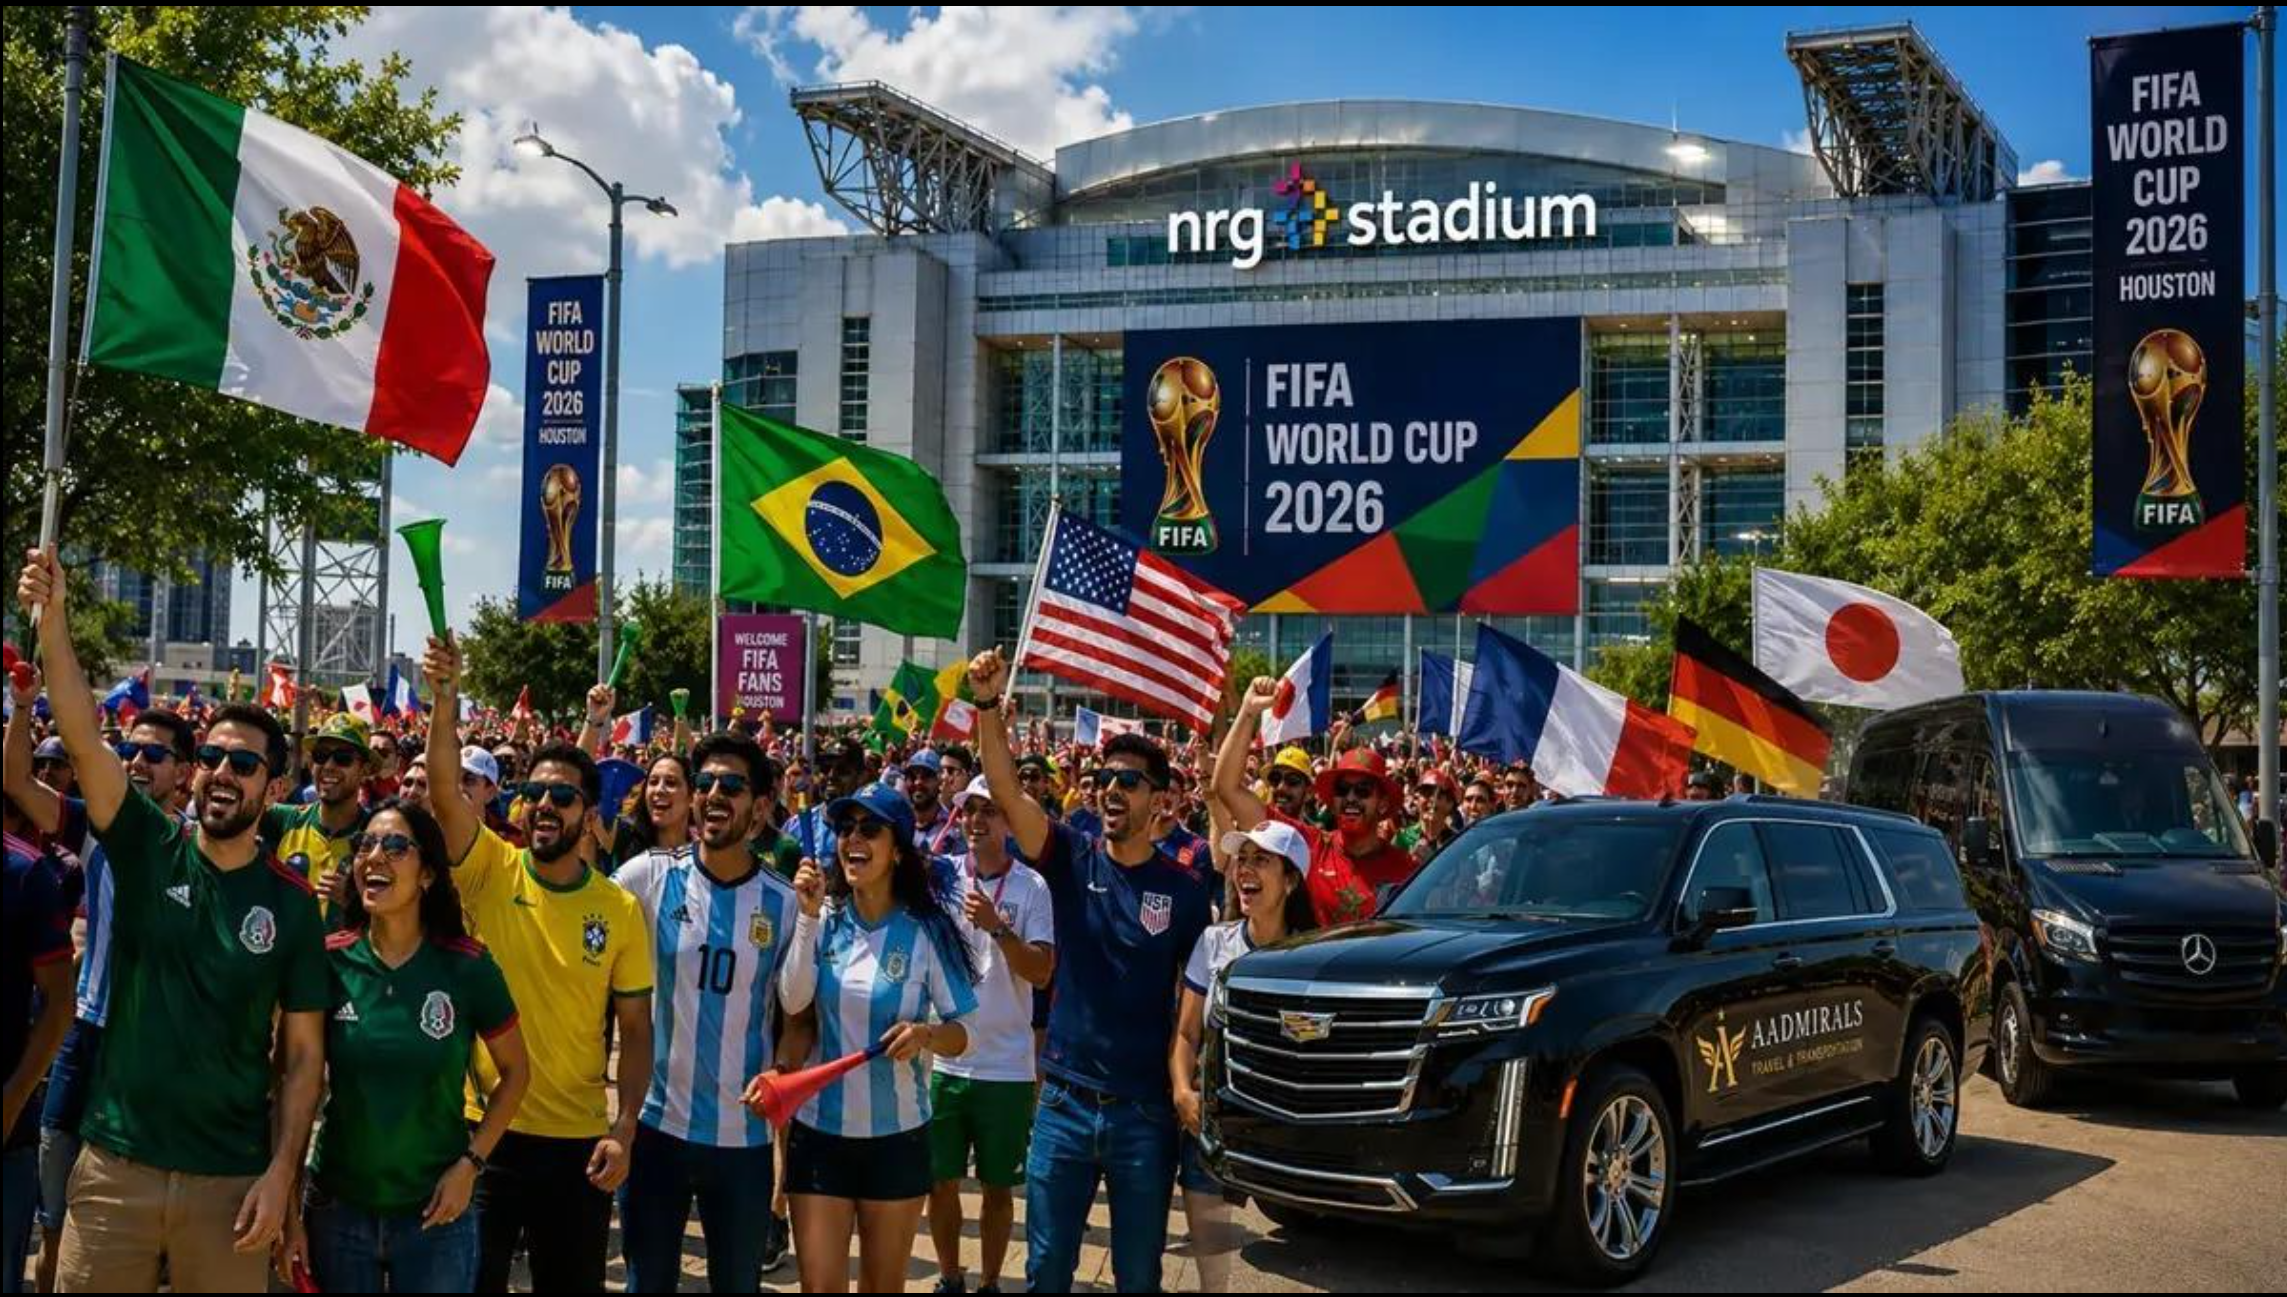
Fans outside NRG stadium in Houston. Source: Admirals
Despite its reputation as an urban sprawl auto magnet, Houston ranked 3rd in my initial lineup thanks to the synergy between the World Cup stadium and Houston’s light rail and generally walkable surrounding area Houston’s final ranking inches up a notch thanks to dramatically higher than normal transit ridership and its ability to recover from a setback.
There were 5.5 million total METRO rides (on all transit modes) between June 12–July 8. On the seven match days specifically, METRO’s light rail carried 500,000 riders total, which is nearly 50% above normal daily ridership.
Logistical problems surfaced early: the June 14 Match between Germany and Curacao drew 68,021 fans and coincided with a flood watch. Heavy rain fell while fans were still queued outside, and the stadium played under its closed retractable roof. Metro officials confirmed about 14,000 riders took rail in, and about 20,000 tried to leave by rail afterward suggesting some fans who drove or used rideshare to arrive opted for rail to leave, overloading the exit side. Many were forced to wait outside because of backed-up lines, and it took around two hours to clear the post-game crowd (though no individual had to wait two hours for a transit ride home).
By the second game METRO opened NRG Center as a covered, air-conditioned overflow/waiting space specifically for people waiting on rail post-match, deployed 13 additional buses, added trains to clear crowds faster, modified pedestrian movement patterns and increased signage, and deployed "cooling buses" as a heat-relief measure, not just transportation.
When it comes to transit as well as soccer, we are fond of a good comeback story.
#3: Philadelphia (Previous Rank: #4) “No Softball For You!”
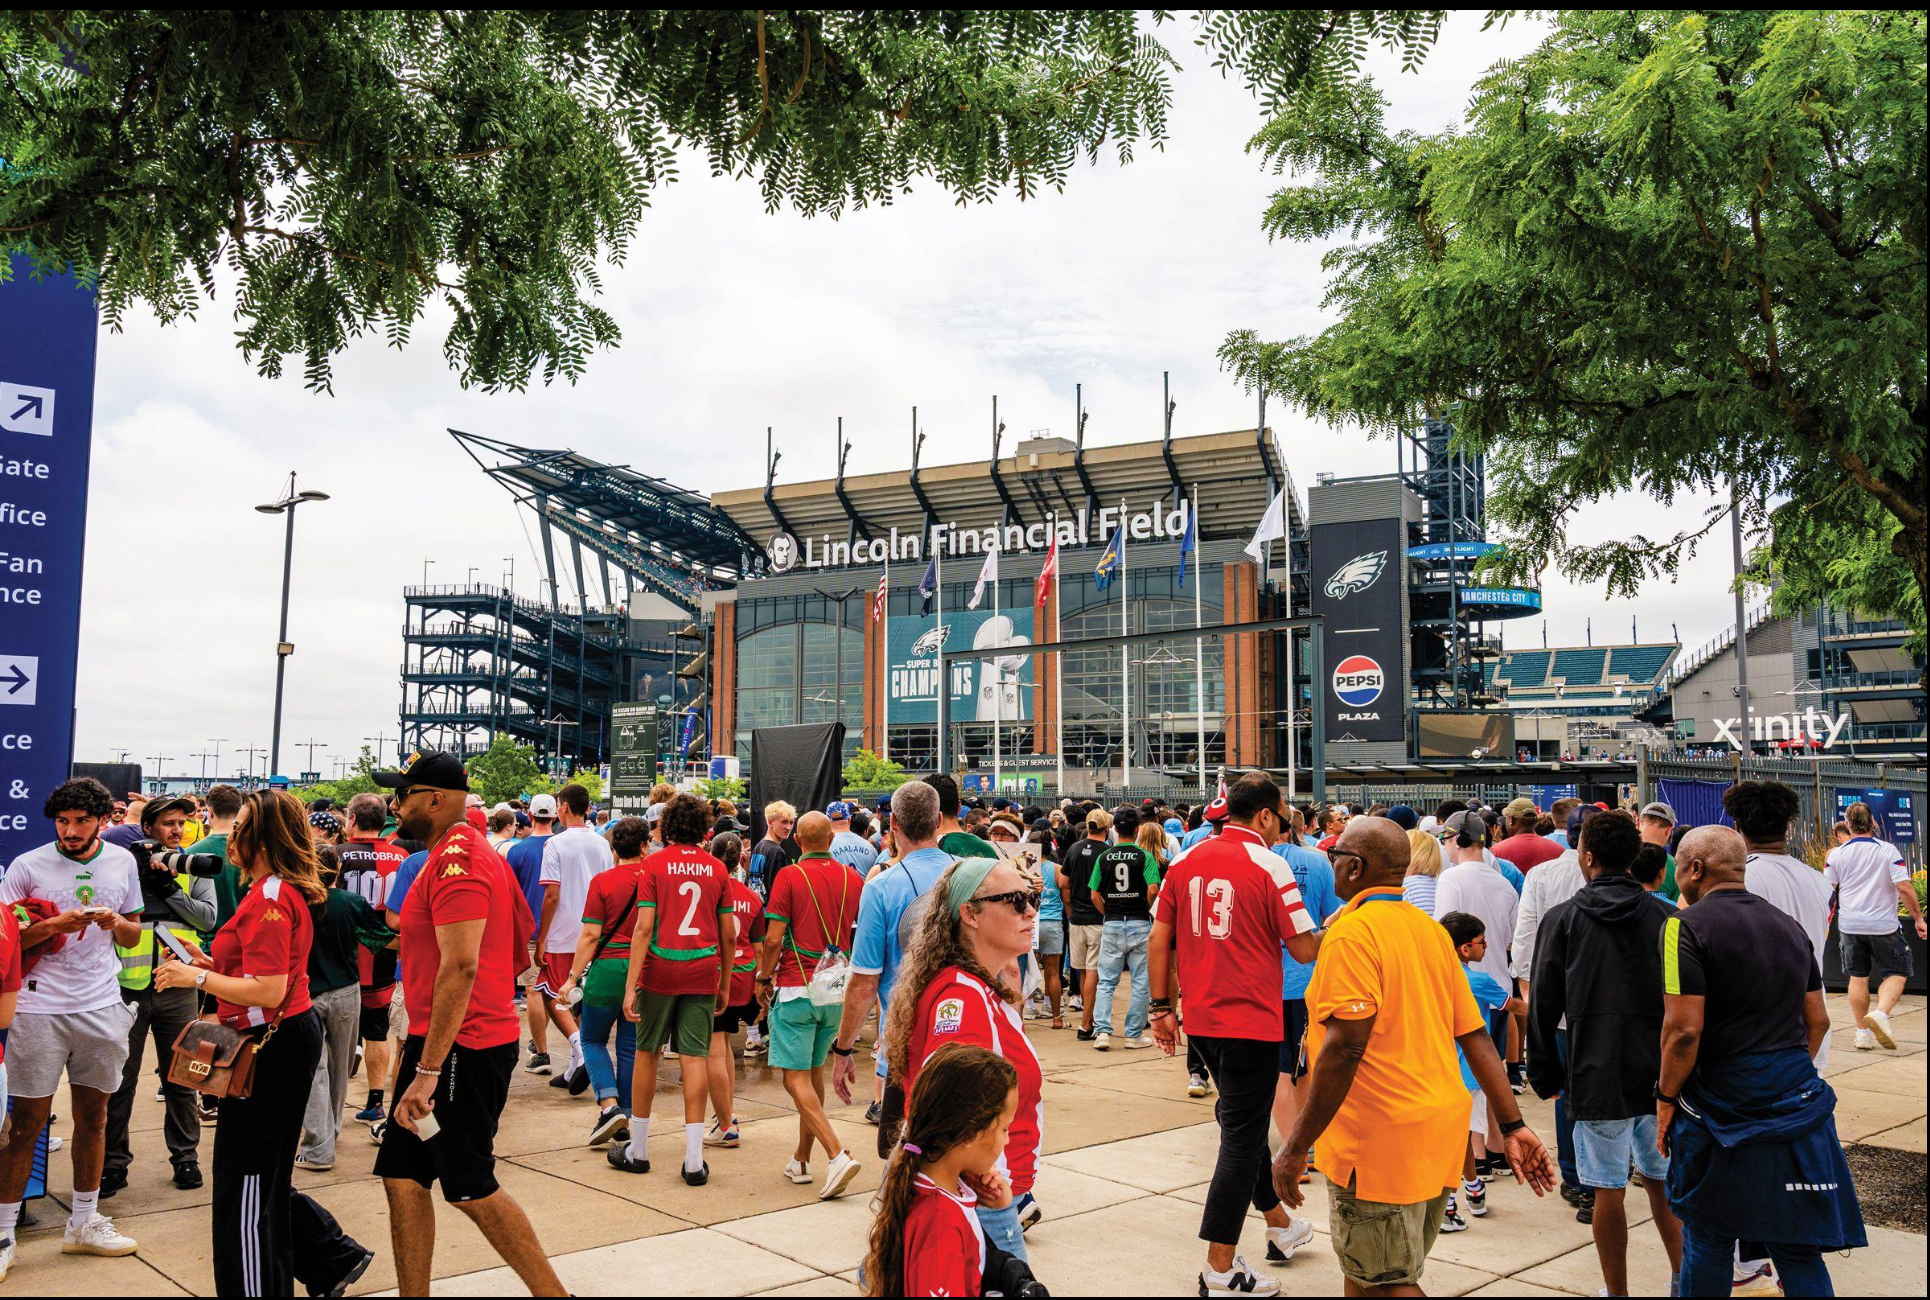
Fans at Lincoln Financial Field. Source: Travelocity
Philadelphia ranked fourth initially, considering its strong transit system and history of successfully providing major event transit one the one hand and the stadium not being as walkable as venues in Seattle, Atlanta, and Houston, on the other. And, unlike its peer agencies in Seattle, Houston, Atlanta, and the Bay Area, which operate multiple stations a close walk from the match, SEPTA needed to move large crowds to and from the came through a single terminal: the NRG station.
SEPTA delivered. The Broad Street Line averaged ~31,000 riders per match to/from Lincoln Financial Field and SEPTA’s NRG Station averaged 25,671 passengers leaving after each match — 61% higher than the 2025 Eagles season average (16,000). Peak ridership at the station occurred on the June 19 Brazil vs. Haiti match, which resulted in 29,162 riders, Philly's second-highest stadium-complex transit event ever, just short of the record of 31,087 set after the Eagles' January 2025 NFC Championship win.
SEPTA’s Ride Philly PHLASH bus service, which connects popular cultural and tourist sites, saw an 800% ridership increase, and its Indego bike share recorded its second highest ridership week with visitors accounting for about 20% of all bikeshare trips, evidence of the City’s ability to provide sustainable transportation writ large. This result along with SEPTA’s ridership increases compared to prior major events boosted Philly from 4th to 2nd.
That said, it wasn’t always a great experience for locals. Fairmount/Brewerytown residents near the 39-day, Lemon Hill Fan Festival reported being ticketed or towed despite having valid special residential permits — including a resident whose car (with softball gear inside, daughter playing in a championship game the next day) was towed despite email confirmation of a valid permit. Resident Ruth Nacey described running down 24th Street when she learned her car was being towed, yelling: “I registered! I live here! I have an email confirmation!” Ultimately, her daughter got her gear back and played anyway.
Go Hurricanes. They won the championship.
#4 San Francisco Bay Area (Previous Rank: #5) “Oh Ye of Little Faith”
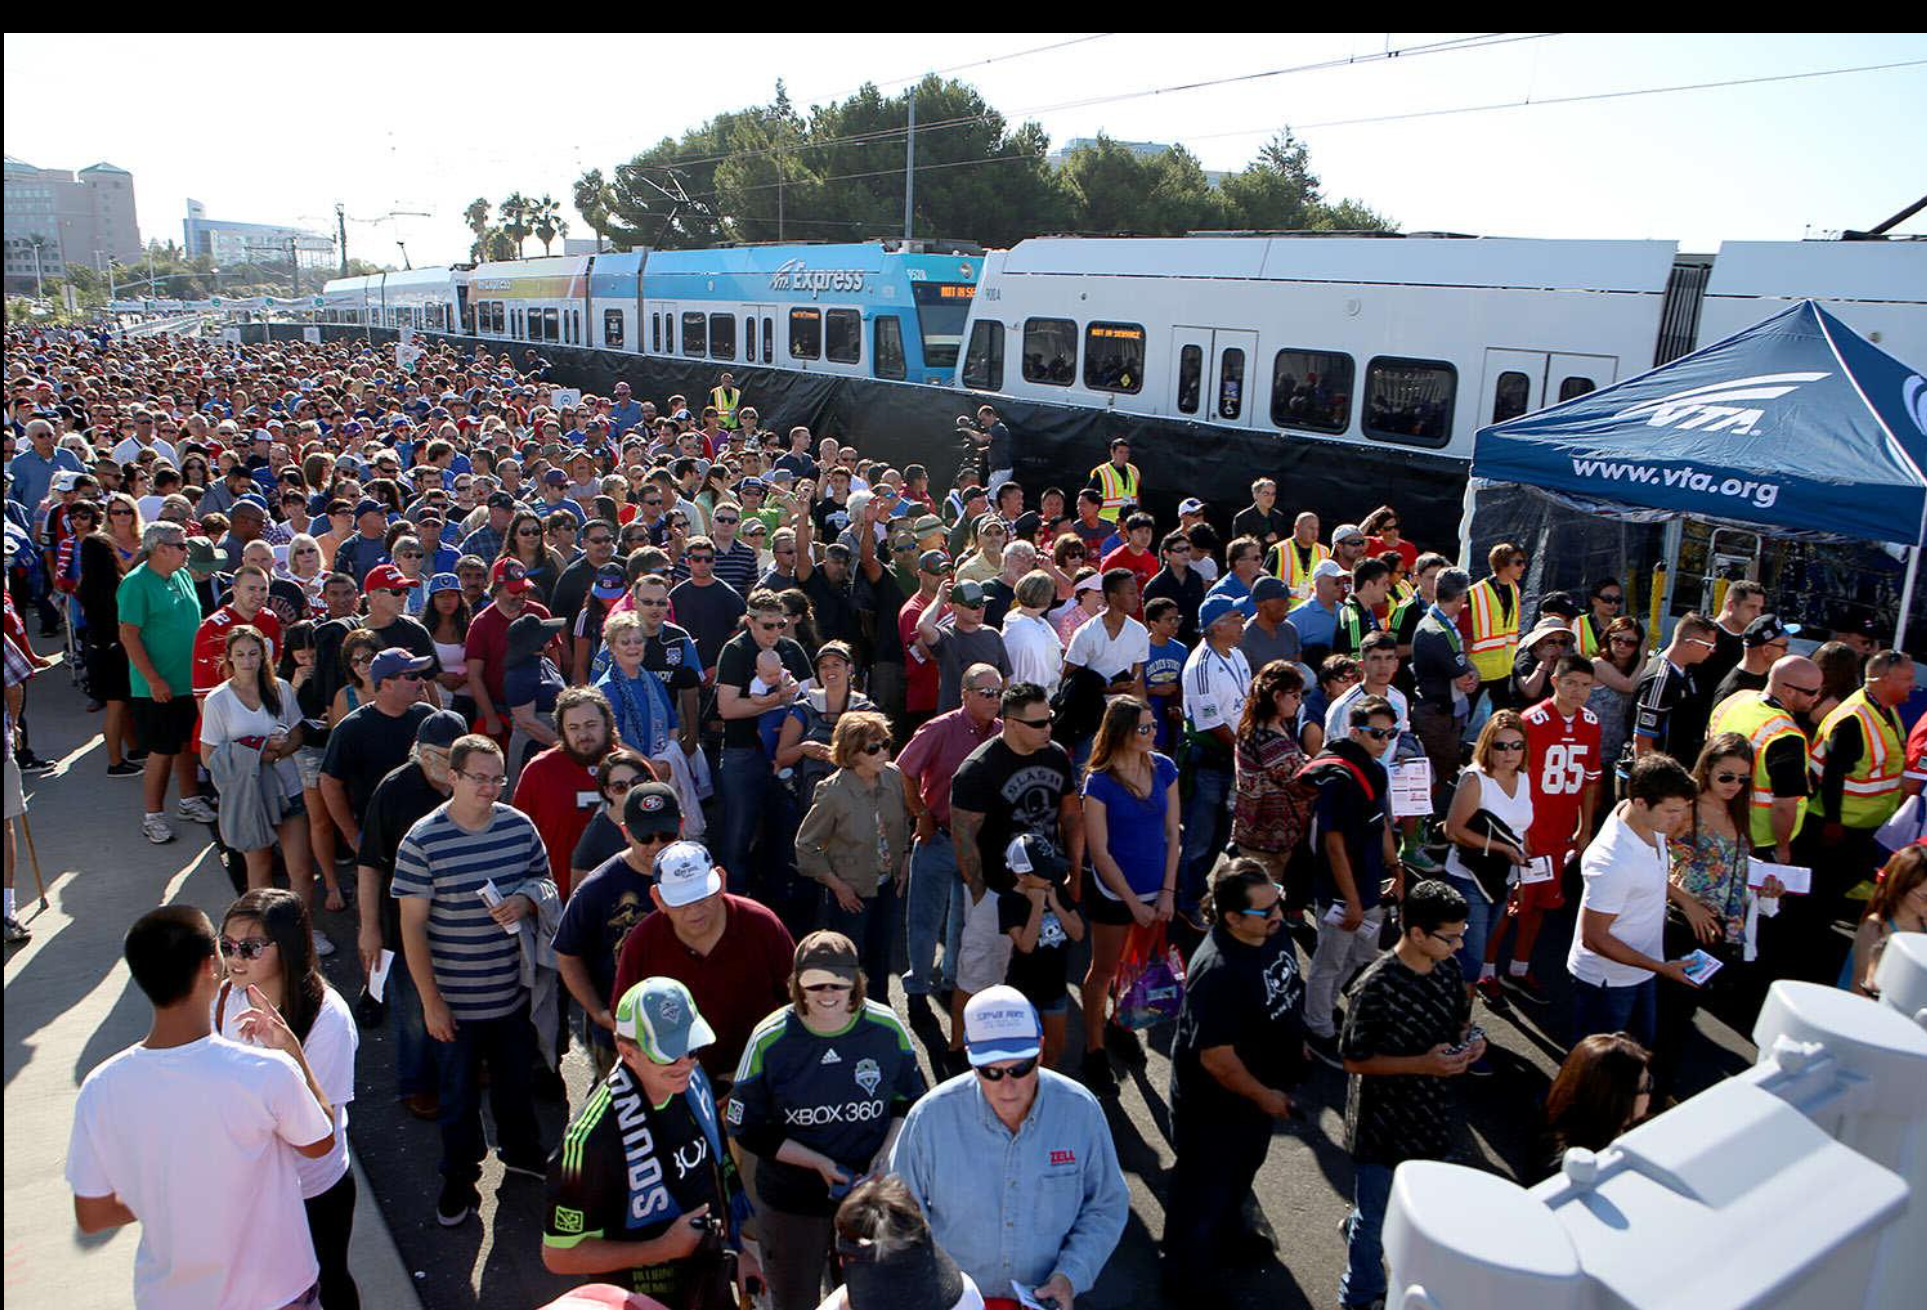
Fans outside of Levi Stadium. Source:
I had my doubts about whether fans would flock to the World Cup on transit. Unlike other host cities, there is not a single transit system serving the stadium. Instead, visitors need to trip chain via BART, Caltrain, or ACE to VTA light rail, a journey that can take over 90 minutes for fans commuting from downtown San Francisco. This also required agencies that normally operate independently to function as one integrated network.
San Francisco’s performance proved me wrong. The opening match established a new transit ridership record for any event at Levi's Stadium, with 37,642 passengers using VTA service and thousands more arriving via connecting regional rail services. The BART Milpitas station, used for transferring to VTA, exceeded the transit volume for both the Super Bowl and Taylor Swift concerts at Levi's Stadium
There were some snags. For example, after one evening match, VTA ended service at its scheduled time, leaving several dozen fans and stadium workers stranded because digital signs and announcements did not clearly communicate that the final trains had departed. Even so, record event transit ridership, coordinated transfers, and rapid postgame crowd clearance showed that institutional integration can compensate for some geographic disadvantages.
#5: Atlanta (Previous Rank: #2): A B+ Performance (B is for Belt Line)
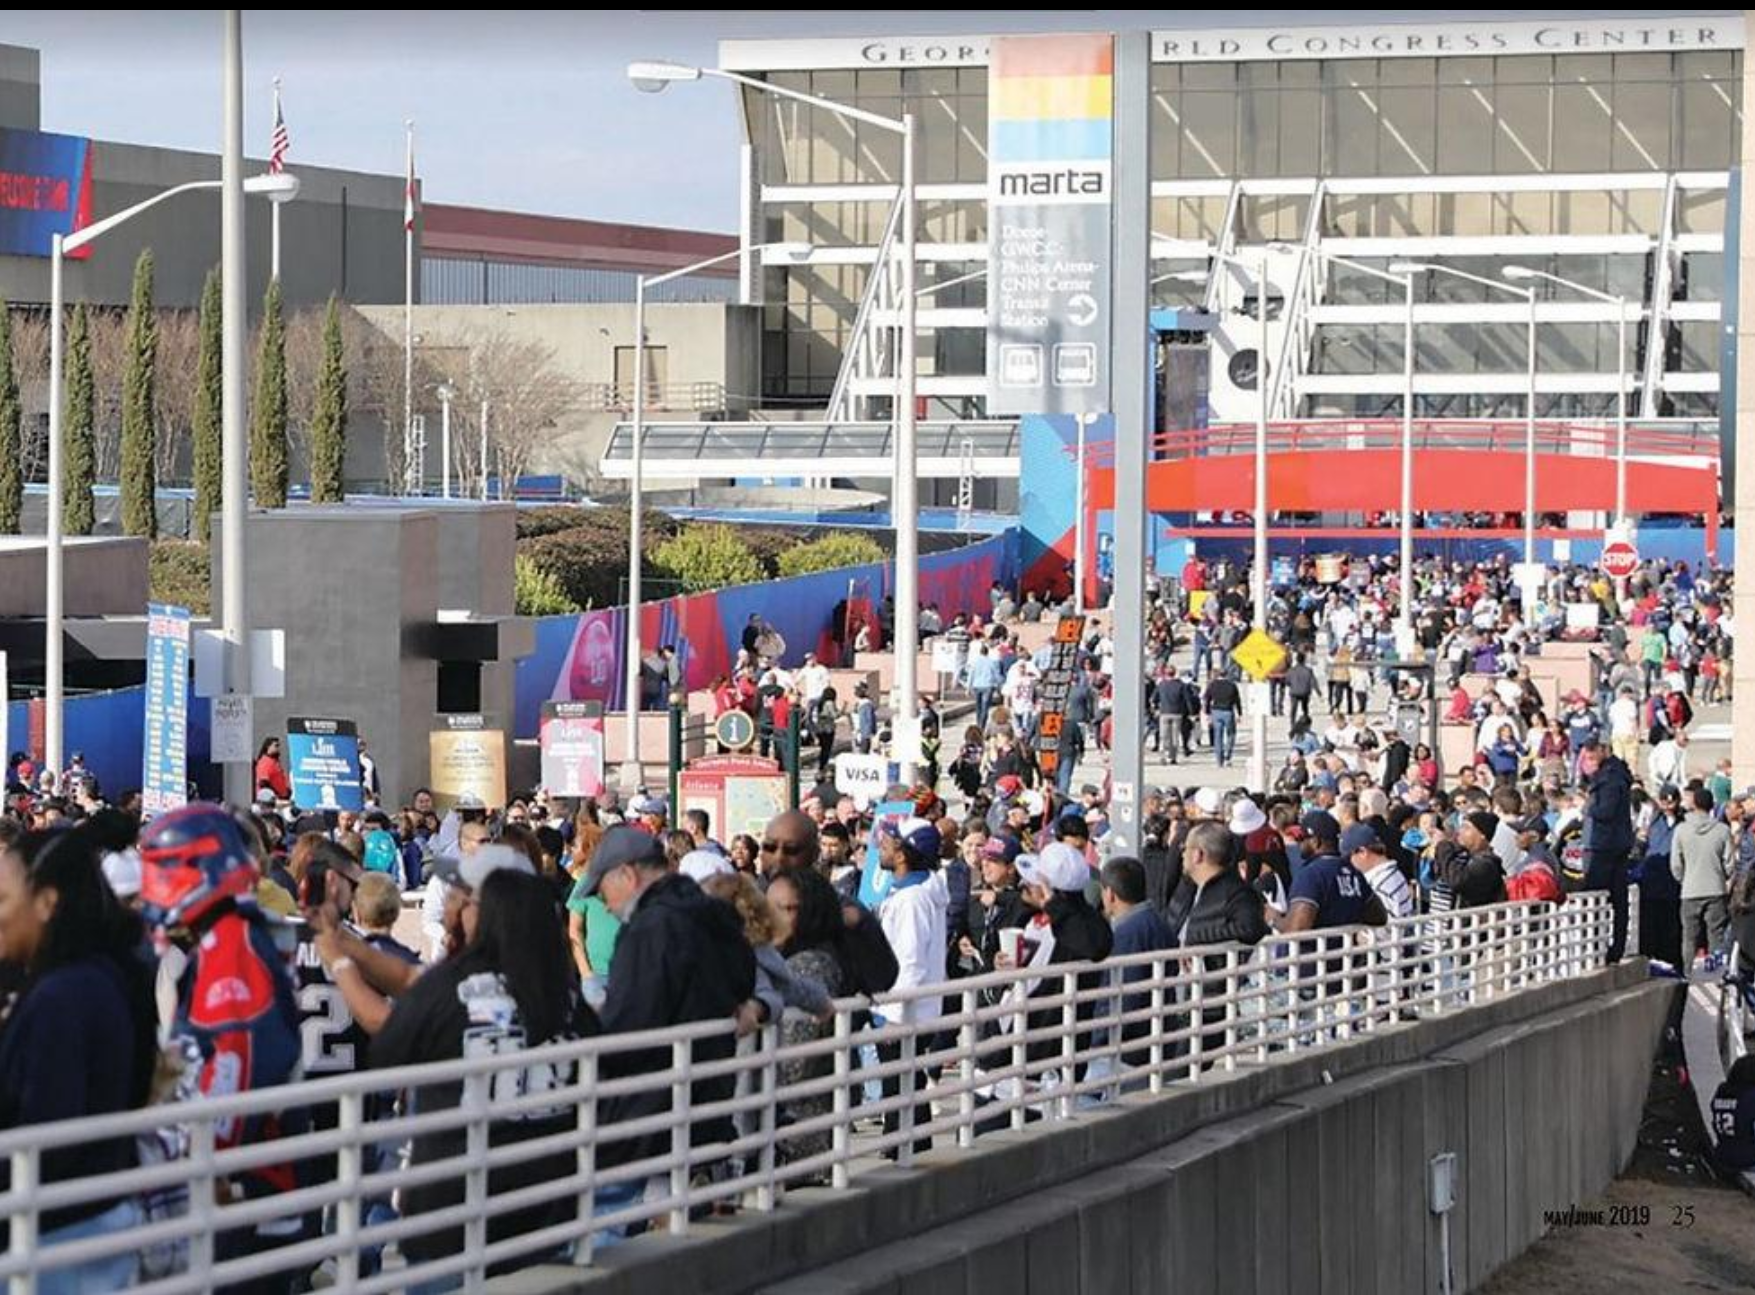
Fans outside of Mercedes-Benz Stadium. Source: Transit CX
Atlanta turned in a solid World Cup Performance and the fact that it’s ranking slips from #2 to #5 is not due to any failures or planning or execution, just that other cities did a better job exceeding expectations. MARTA ridership increased over normal but not as much as in Houston, nor did transit set any records or blow past major event service totals as was the case in Seattle, Philadelphia, and the Bay Area.
Between 4.7 and 4.8 million MARTA trips occurred over the 35-day event window and ridership was 2 to 3.5 times normal daily volume on match days, or roughly 27% higher than usual during the event window, a great but not extraordinary outcome with no new ridership records set. There were no major service breakdowns or safety incidents reporting during the tournament itself.
Not all residents were thrilled. Just before kickoff, the Historic Vine City Civic Association representing the majority Black neighborhood adjacent to Mercedes Benz Stadium (a neighborhood that experienced a history of displacement in the name of economic development) released a report claiming the city and FIFA had reneged on promises made to the community ahead of the tournament. Organizers alleged the city paused permits in World Cup activation zones, which had the effect of blocking Vine City from hosting its own summer community events during the tournament window and banned independent street vendors and food trucks during tournament hours.
On the other hand, progress on the Belt Line brought good news. Just three days before the city's first match (Spain vs. Cape Verde), officials completed the trail's long-awaited "U" — connecting the Northwest, Westside, Southside, Eastside, and Northeast corridors into 16.7 continuous miles for the first time since Ryan Gravel first sketched the idea as a Georgia Tech thesis in 1999. Gravel's original vision paired them with light rail, the piece of the Beltline still mostly unbuilt decades later. But timed deliberately to be ready for the tournament, hundreds of thousands of visitors got to experience a version of Atlanta's most ambitious infrastructure project closer to whole than it had ever been before.
#6 Los Angeles (Previous Rank: #8) Shuttle Success
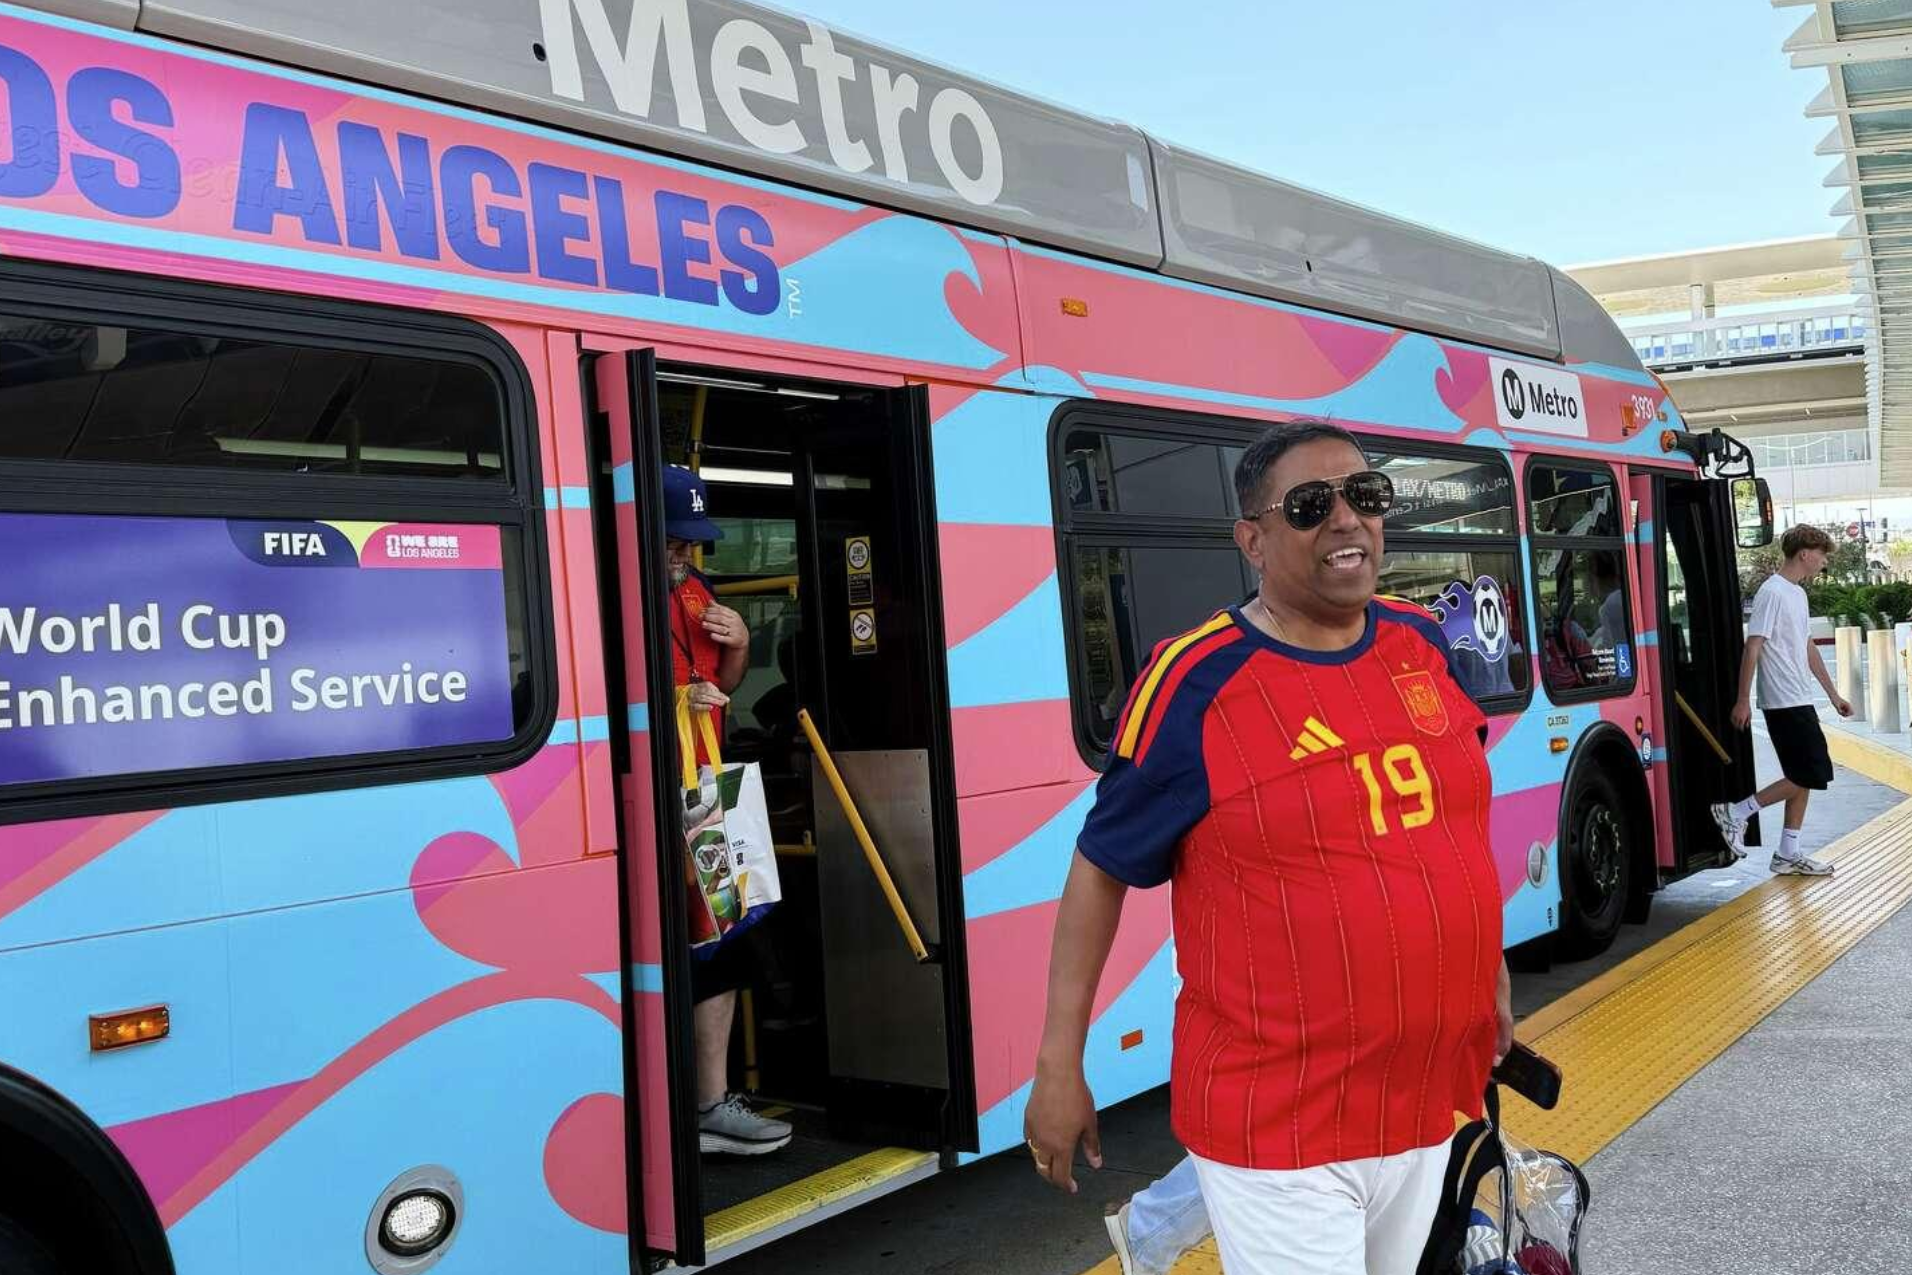
Los Angeles fans using special event bus service. Source: SeattlePI
Los Angeles succeeded because planners built a workable temporary transportation system to compensate for a stadium location that still lacks permanent high-capacity rail. In the absence of a rail line to the stadium, LA ran hundreds of shuttles from nearby transit stations and other gathering points, one of the more improvisationally successful transit operations of the tournament. As a result, it rises two spots in the rankings.
Shuttle ridership increased match over match from Match 1 (US-Paraguay) with 18,551 shuttle rides through March 4 (Iran-Belgium) with 29,000+ rides. In the region as a whole, several World Cup match days became among the busiest transit days since the pandemic, with rail and bus boardings substantially exceeding typical summer levels. Service was expanded across multiple lines, and Metro reported that the K Line experienced especially large increases because of its role in serving shuttle operations.
However, as was the case in Philadelphia and Atlanta, some residents drew the short end of the stick. Two viral videos showed law enforcement blocking Inglewood residents from entering their own neighborhoods on a Monday-night match, including a family with mobility issues being told to park elsewhere and walk, or wait in the car until the event ended. The problem traced back to Metro requesting L.A. County Sheriff's assistance to keep bus movement flowing, which the Sheriff's deputies executed as full street closures. Both Inglewood's mayor and Metro publicly apologized.
When it came to freeway traffic, I-405, I-105, and I-110 gridlock was severe, but what else is new.
#7 Kansas City (Previous Rank: #9) Streetcar Success
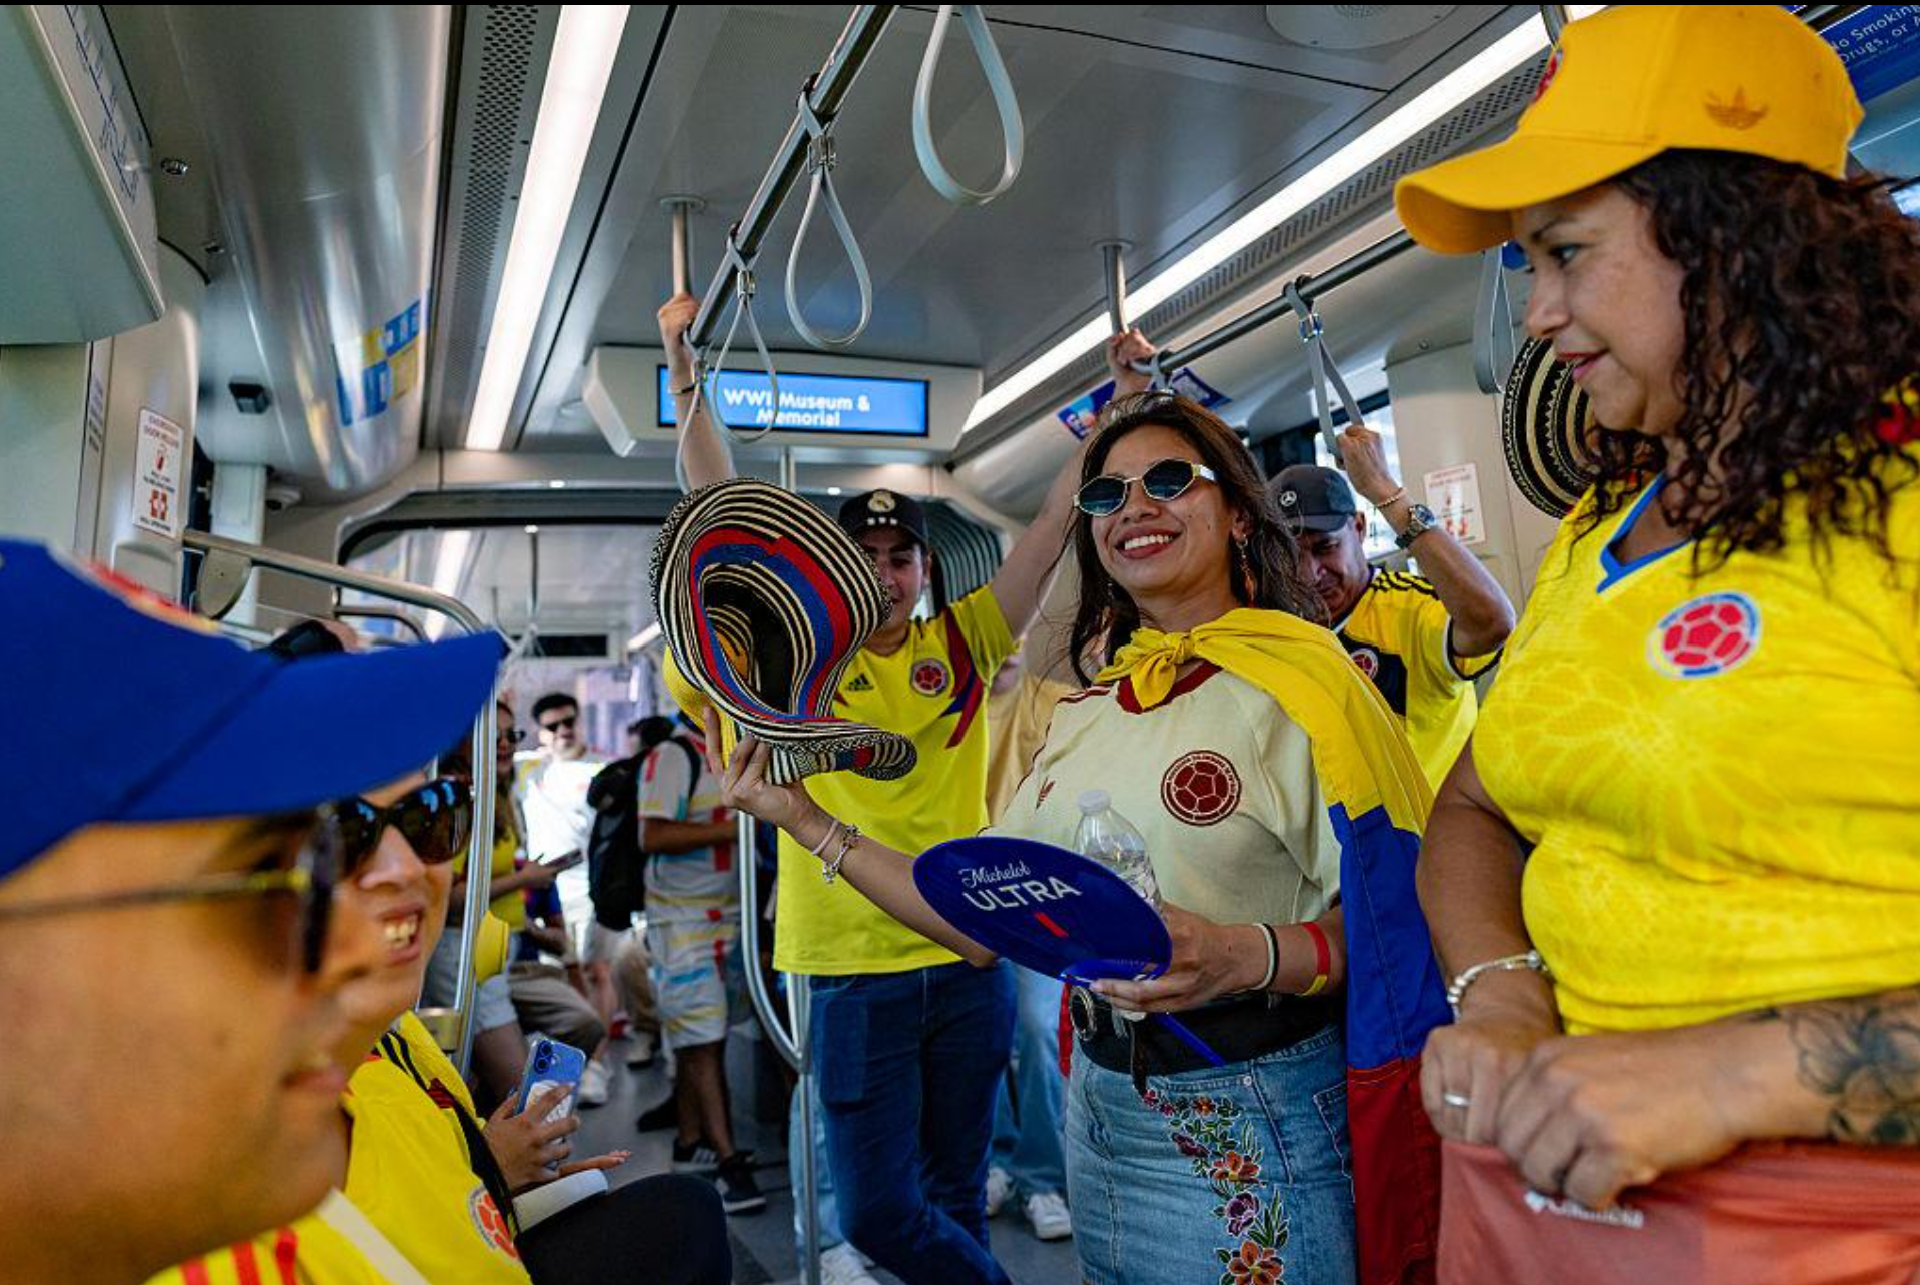
World Cup fans riding the Kansas City Streetcar. Source: US-FBL-WC-2026-FANS
My original rankings were appropriately cautious of Kansas City’s ability to pull off a car-free World Cup. Arrowhead (Kansas City Stadium) is not adjacent to fixed-guideway transit, and Kansas City lacked the mature rail systems of Seattle, Atlanta, or Philadelphia or even a Regional rail connection found in the Bay Area. On paper, that should have been a significant disadvantage.
Instead, Kansas City demonstrated that an intelligently designed temporary transportation network can outperform the underlying infrastructure.
Kansas City’s World Cup transportation story centered on ConnectKC26, a purpose-built network that provided regional bus services to fans. By the end of the tournament these services had carried more than 140,000 passenger trips.
And even though the KC Streetcar operates nowhere near the stadium, it became one of the tournament's biggest transportation success stories. June ridership reached a record 698,705 passenger trips compared with 162,057 in June 2025. Seventy five percent of all streetcar trips occurred outside the Fan Festival destination itself, implying that visitors and locals used the Streetcar to explore the city’s adjacent neighborhoods. Kansas City’s success in accelerating everyday mobility rather than merely generating trips to and from a stadium boosted its rank from 9th to 7th.
However temporary bus improvements disappeared on July 12, and KCATA (the area’s transit agency) warned that more than a dozen routes could be eliminated because of funding shortfall. A temporary transportation network can successfully reshape how visitors experience a city, but sustaining those improvements afterward is a challenge.
#8 Boston (Previous Rank: #6) Between Good and “Wicked Good”
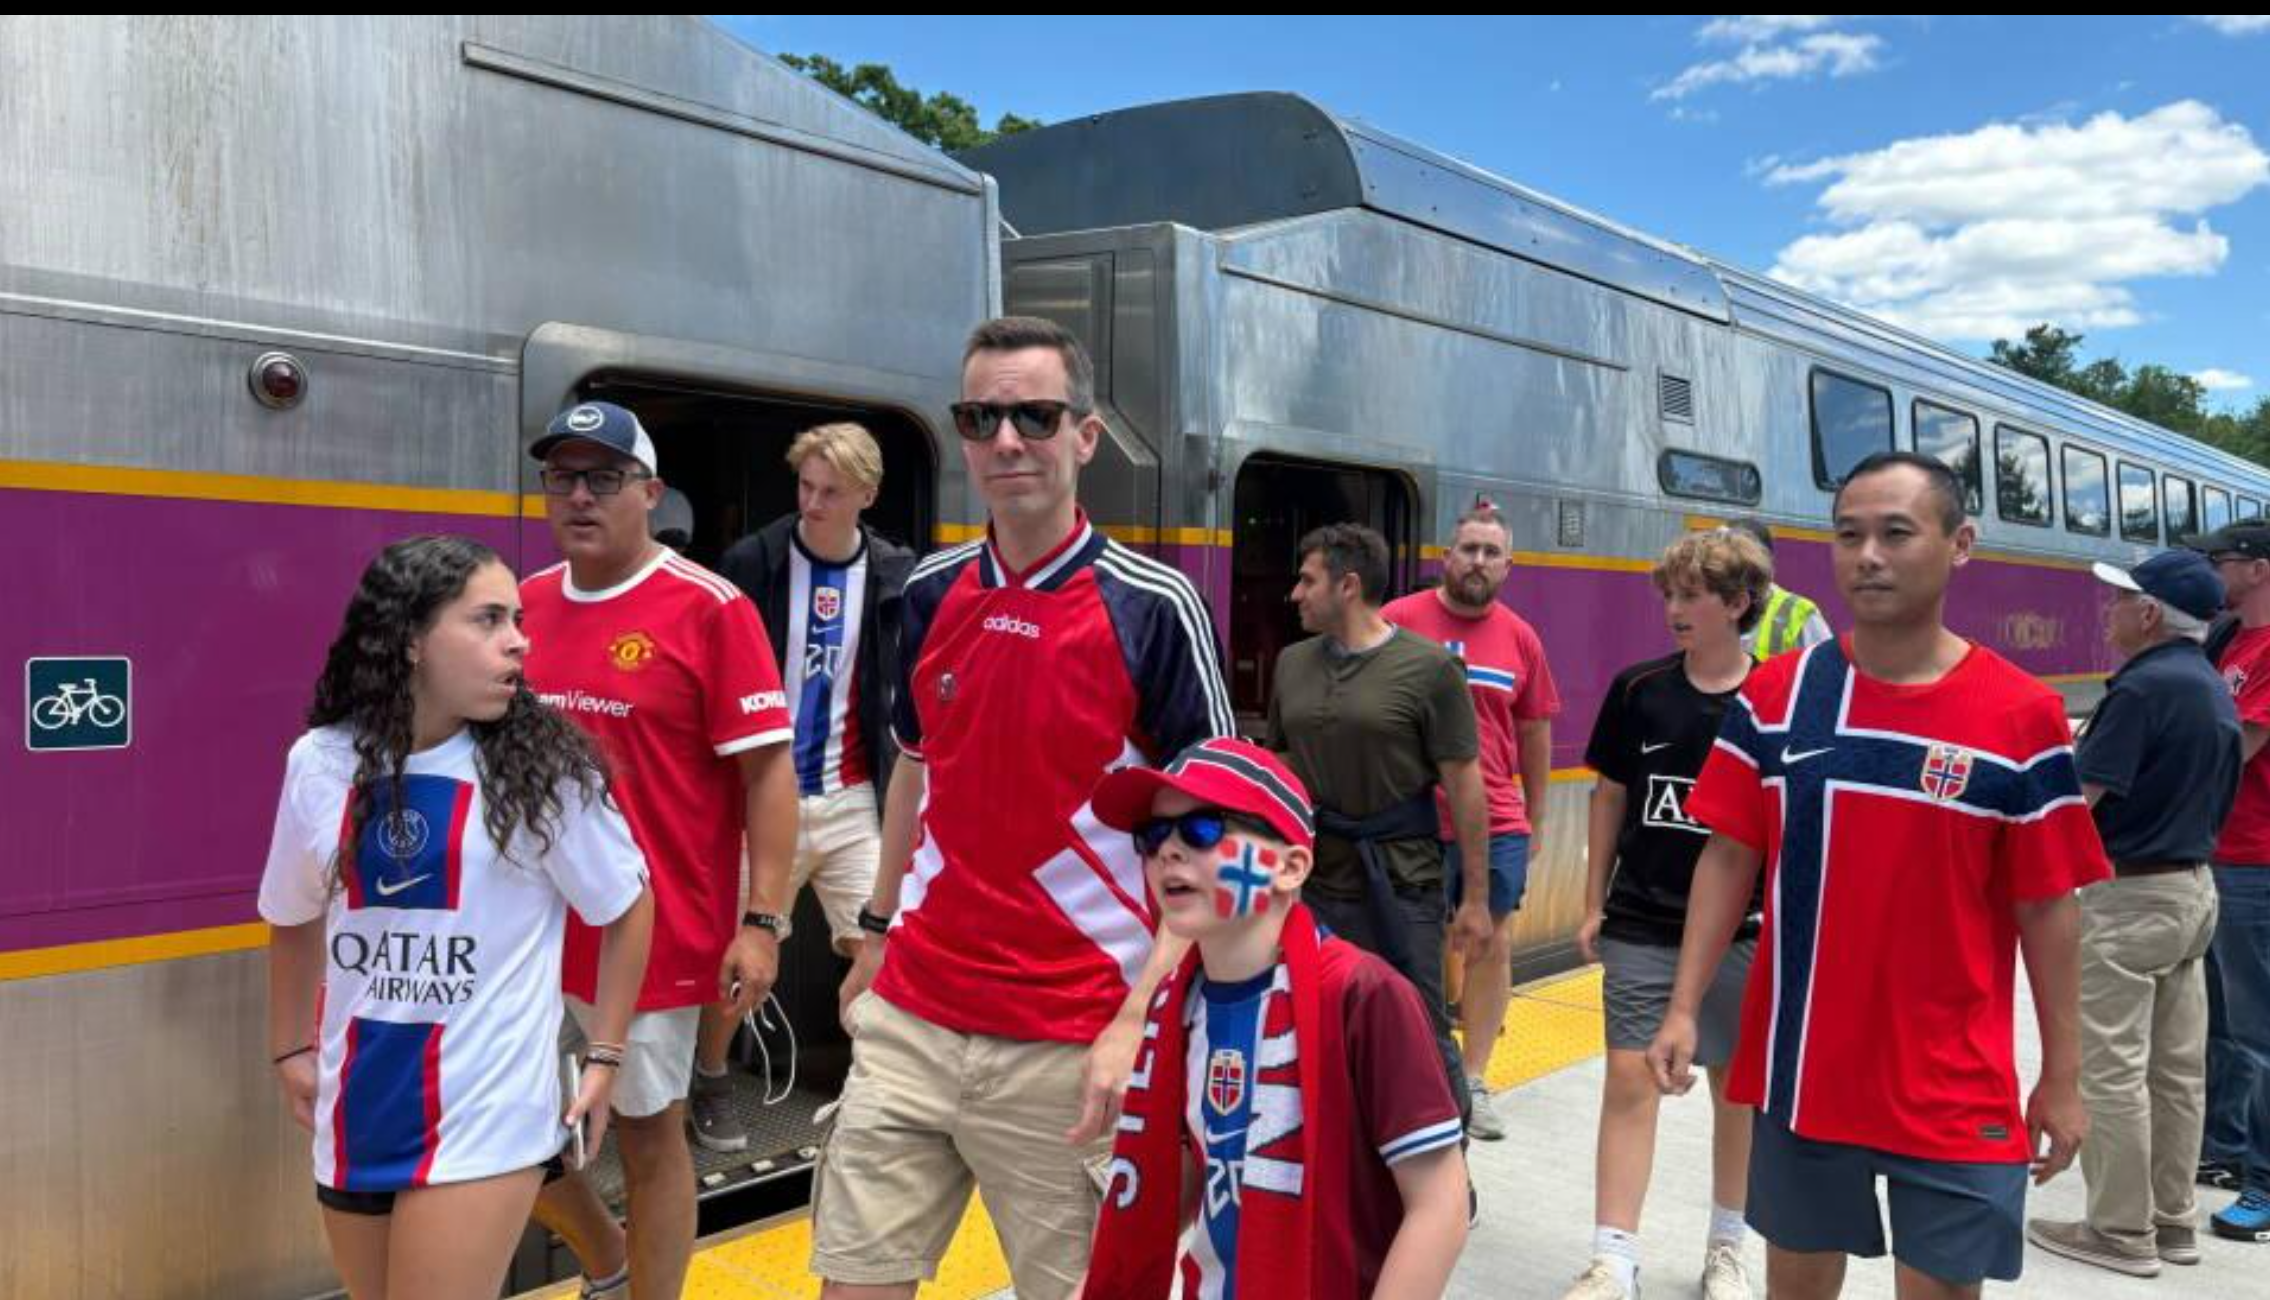
World Cup Fans head from the MBTA commuter rail to the game. Source: WGBH
I originally ranked Boston lower than many people expected because Gillette Stadium combines several challenges: an exurban location, limited commuter rail service, and little within walking distance.
Prior to the tournament, MBTA invested $35 million in infrastructure upgrades to accommodate a crush of fans and, to partially recoup the cost, charged spectators an $80 round trip on the "Boston Stadium Train," South Station to Foxboro, a 400% markup over the normal $20 special-event fare MBTA already charges for Patriots games (the ticket could also be used for travel anywhere in the network on match days).
The steep price may be why actual transit ridership did not exceed projections. Match-by-match data shows train usage running consistently below the MBTA's committed capacity of 20,000 per match. Boston appears to have built infrastructure and budgeted for demand that didn't fully materialize. Even though stadium parking was cut 75% (from ~20,000 spaces to ~5,000) specifically to push people toward rail, a meaningful share of attendees still apparently found other ways in (driving to surrounding lots, buses, rideshare) rather than filling the train's committed capacity.
After a rocky opener, average wait times to board at South Station never exceeded 20 minutes, and 100% of ticketed passengers arrived with enough time to clear security and find their seats for the remaining six matches, per MBTA data.
Still, many fans came away satisfied. Laurence Reid (a Brit living in Boston, attending with a UK friend): "We were a bit shocked by the price and why that had to be. But the train rides were fun and logistics worked really well. So we thought the MBTA did a nice job!"
#9 Dallas (Previous Rank: #10) Expectations Met
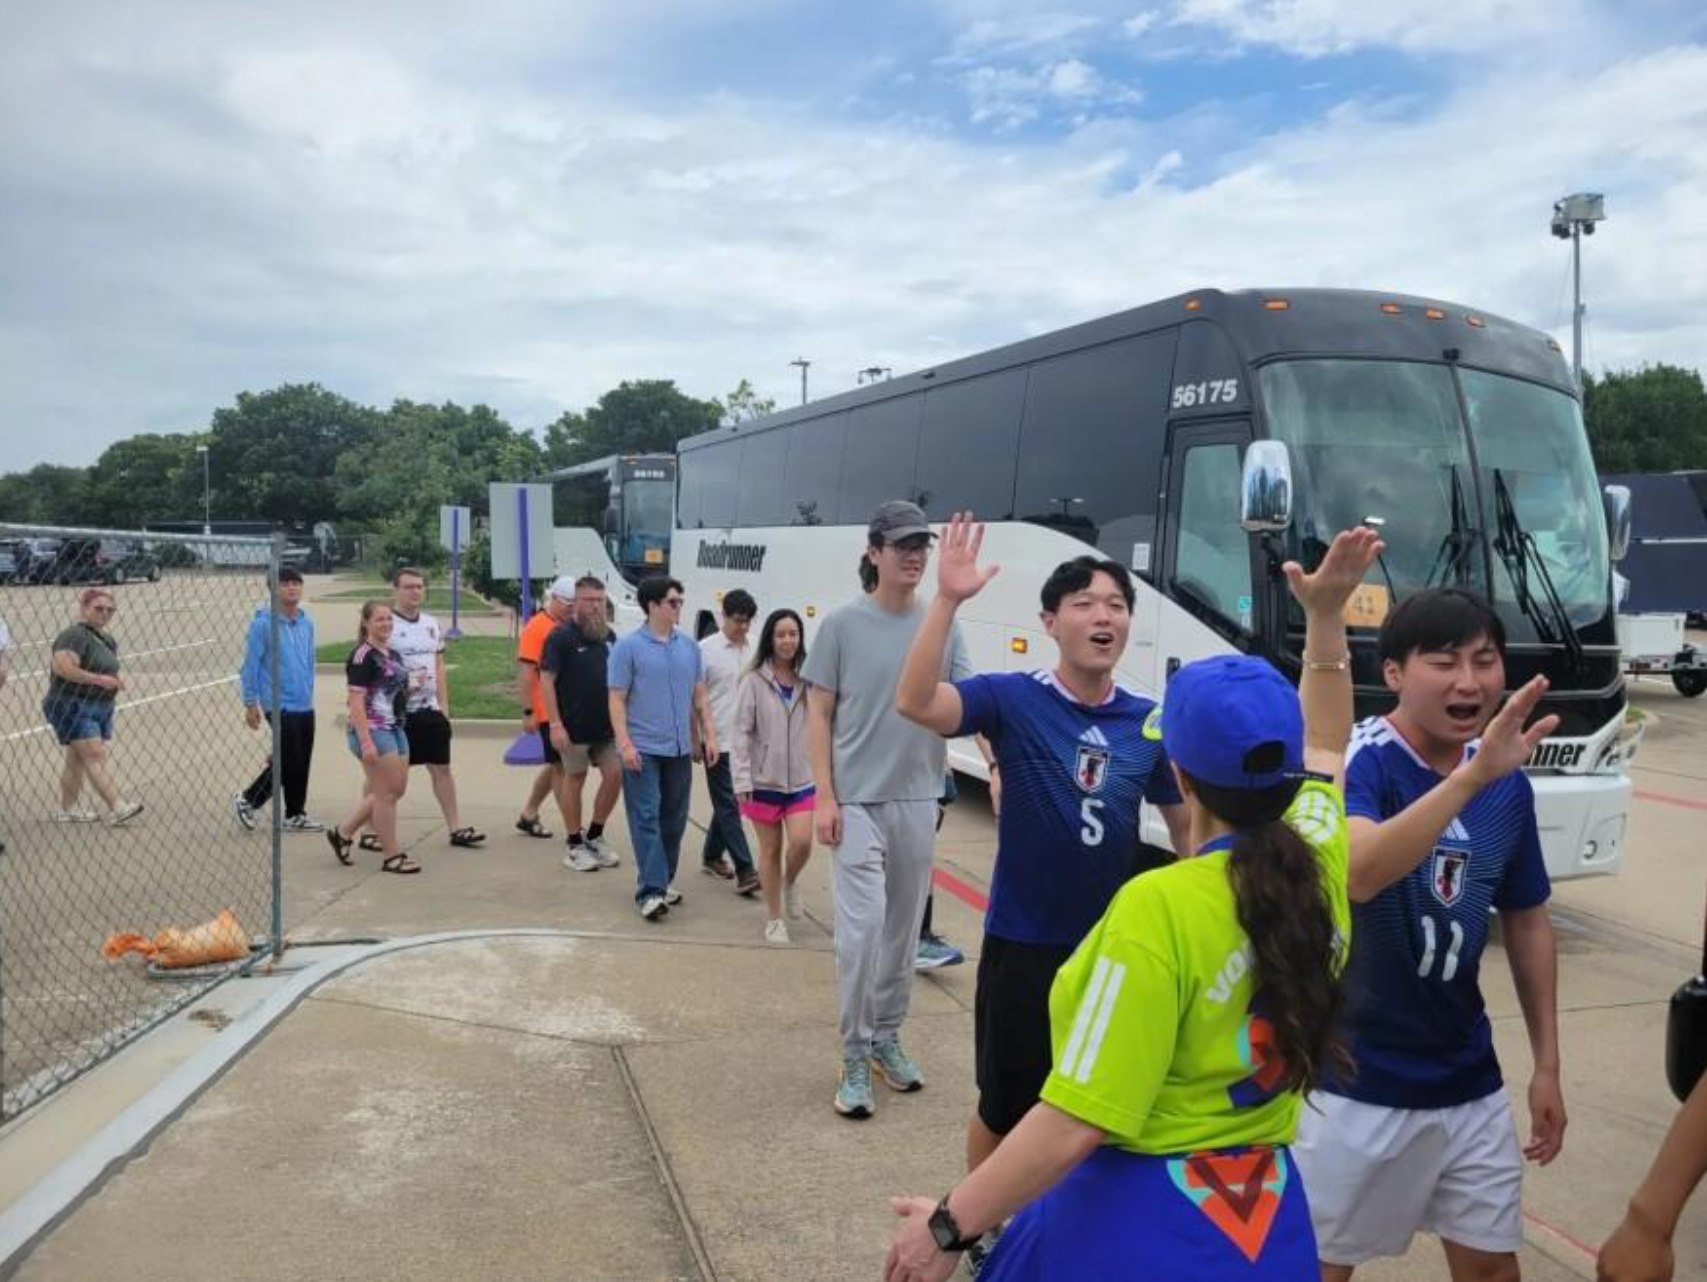
World Cup Fans near AT & T Stadium. Source: KERA news
Dallas–Fort Worth is, in many ways, the anti-Seattle. The Emerald City demonstrated how a transit-oriented stadium embedded in an urban neighborhood can naturally absorb a mega-event. Dallas deserves considerable credit for constructing an elaborate temporary system around its existing structural weakness. Fans boarded the Trinity Railway Express (TRE) Commuter Rail from either Dallas or Fort Worth and rode to the CentrePort Station, whereupon they boarded charter buses to the game.
According to the North Central Texas Council of Governments, around 30,000 fans took TRE and 40,000 rode the connecting bus shuttles to the game. With attendance running up to ~92,000-100,000 per match day, that 30,000-40,000 rail-and-bus figure implies the clear majority of attendees still drove.
As for the quality of the experience, one Dallas Observer reporter's own ride-along (TRE from Carrollton → CentrePort → 8-minute walk to the bus depot → stadium) took just under two hours one-way, about the same as advertised. And there are no reports of major logistical snafus. Transit access worked well for the people who used it, but it didn't flip the region’s fundamentally car-friendly dynamic.
One bright spot: the Dallas Area Rapid Transit system (DART) that serves Dallas but does not provide transit to the stadium, reported a 12.9% ridership increase for the World Cup window, evidence that the city was able to leverage its transit network to provide mobility for people exploring the region, not just traveling to and from the match. This data, pointing to transit’s role in providing greater mobility, boosts Dallas’ position in the rankings up a notch.
Overall, operational excellence can overcome geographic disadvantages, but it cannot erase them.
#10 New York/New Jersey (Previous Rank: #7). The Meadowlands is not Manhattan
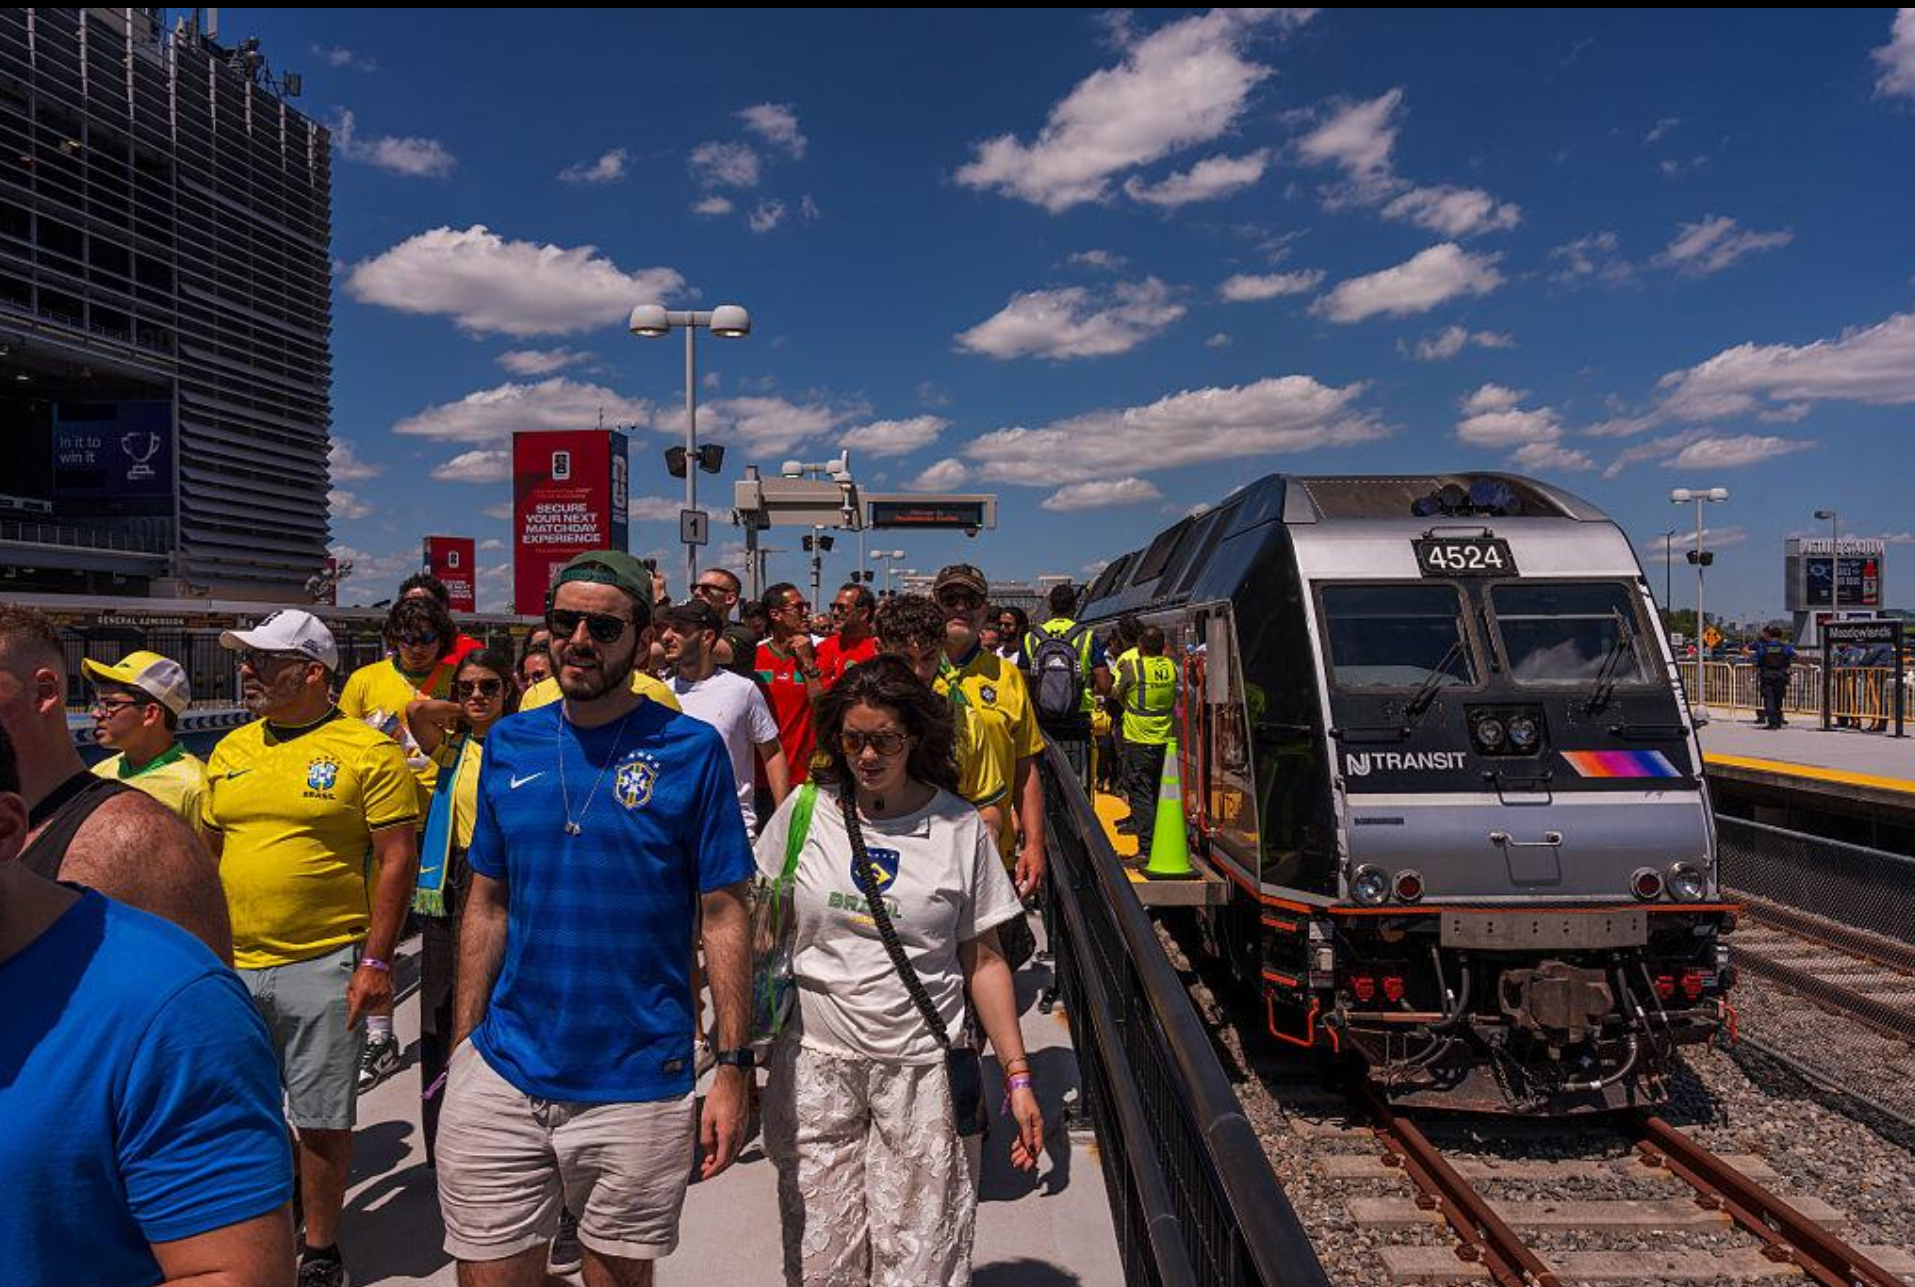
You may have heard the old saying, “the stock market is not the economy.” Well, Manhattan is not the Meadowlands. New York is a great transit region, but MetLife Stadium’s location in Northern New Jersey does not lend itself to a great transportation experience.
Prior to the World Cup, journalists fascinated by the disconnect between an inaccessible stadium just a few miles from a global city center, attempted car-free journeys with the zeal of 19th century explorers summitting Mt. Kilimanjaro. Reporters documented their travels on foot, by bike, bus, rail, and canoe. Many returned humbled. One New York Times reporter wrote: “"Over decades, we have chosen to de-prioritize environments built at a human scale in favor of ones designed for vehicles. In doing so, we have become increasingly alienated from walking, the most accessible form of transportation, to the point where it now seems absurd, even impossible, to the people whose job it is to think about how we move through space"”
In this context, World Cup Planners worked heroically and at great expense to provide a work-around, a partially dedicated bus-only lane to double transit capacity and transport the estimated 40,000 fans per game between the Secaucus New Jersey Transit Station and MetLife. New Jersey Transit estimated the total cost of the improvements at $62 million, an amount they initially tried to recoup by charging fans $150 to take the train to the game. After FIFA and local officials cried foul, NJT lowered the ticket to $98.
Ultimately, transit ridership averaged around 25,000 people per match. NJT overbudgeted by around $16 million to serve a crowd that did not show up as predicted. It’s not clear where the missing ~15,000 fans per game went instead: did they drive to off site parking, take rideshare, or simply not attend in the volumes projected? New York Governor Hochul's competing New York-side shuttle bus at $20 round trip reportedly sold out, a contrast Hochul used to needle NJ Transit publicly: "When people found out they'd have to pay upwards of $100 on a ride that used to cost $12.50... we said we have to have an alternative."
NJ Transit CEO Kris Kolluri publicly blamed FIFA and American Dream Mall for supplying flawed demand data: "If the people who are our partners had told us about a 20-25,000 person system, I would have planned for a typical concert and not spent all this money... We are executing the plan that we collectively worked on for three years. If people decide not to follow the plan, that's not my issue."
Some fans attending the opening night (Brazil vs Morocco) game might have wished they had taken the train. Hundreds were stranded outside MetLife past midnight (over three hours after the final whistle) unable to get rideshares, which were funneled to a single off-site pickup point at Meadowlands Racing and Entertainment. Uber moved ~6,500 people but publicly stated it couldn't handle the following Tuesday's projected demand.
Even so, it’s better to overprepare than to underprepare, and the fact that hundreds of thousands of people moved through Penn Station, NJ Transit, and Meadowlands operations without a major transportation collapse is a major operational achievement.
#11 Miami (Previous Rank: #11) “Still Bad, but Slightly Less Bad than We Thought”
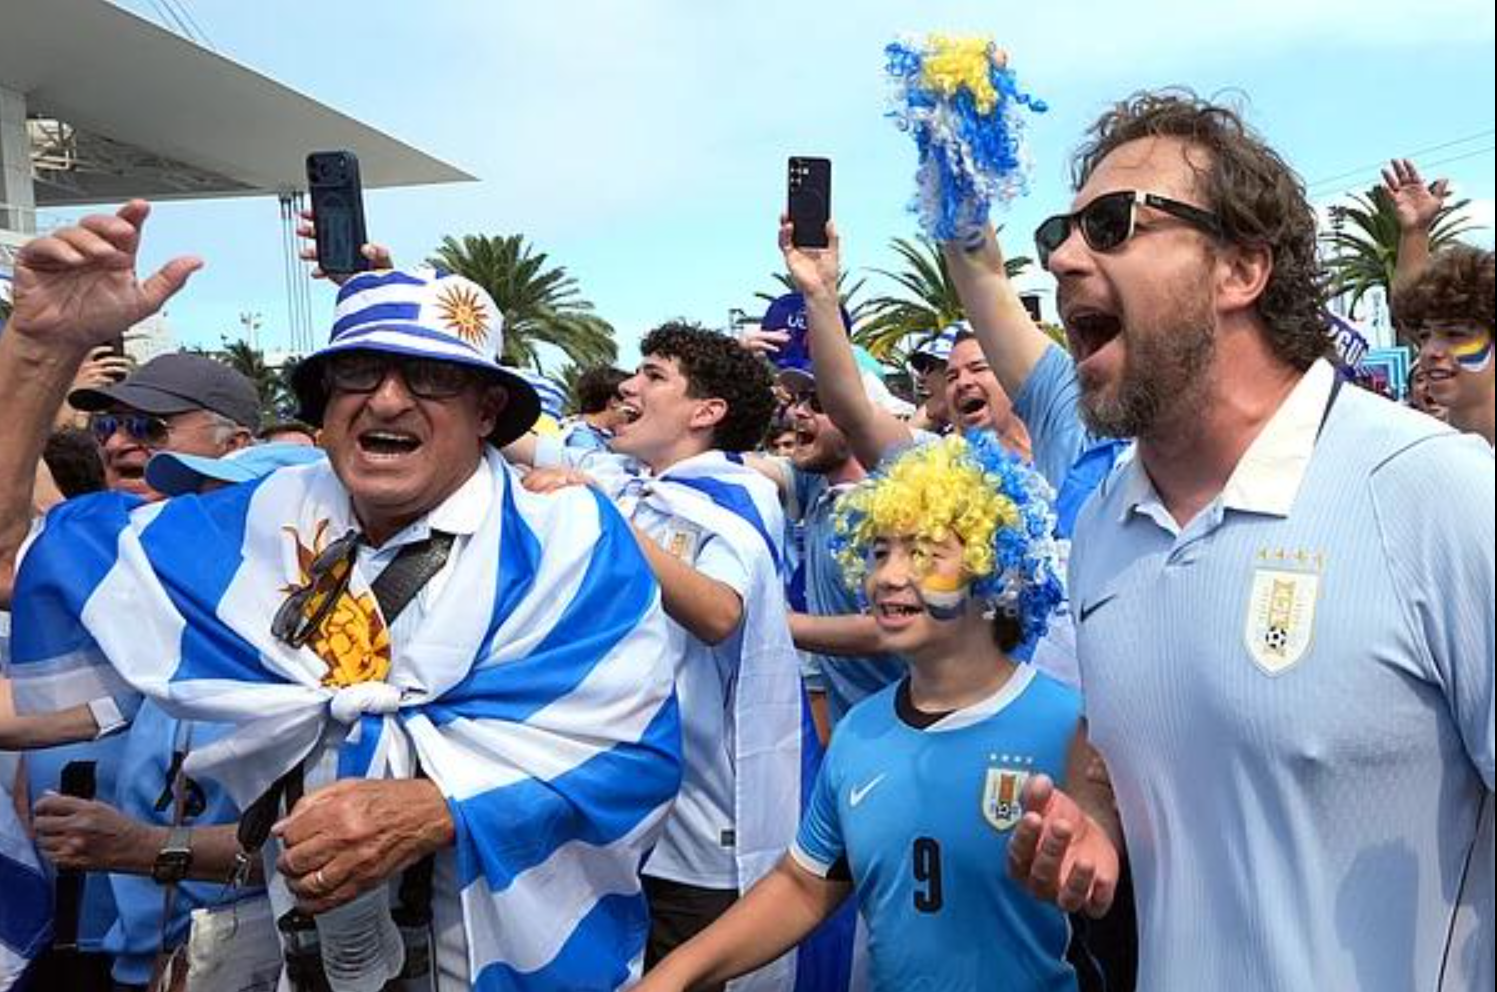
Fans before a game in Miami. Source: Outlookindia
My original rankings had Miami coming in last when it comes to providing car-free mobility and it remains in last place after the final whistle blew. This in large part due to very little publicly released post-event performance data. It’s possible ridership on transit and shuttles exceeded expectations, but, so far, we don’t know about it.
As was the case in Kansas City and Dallas, Miam’s Hard Rock Stadium is in a transit desert far from the main downtown where most fans stayed. In response, event organizers relied on a carefully orchestrated network of free express shuttle buses connecting four regional transit hubs to the stadium.
However, I could not find any information on the Game Day express shuttle ridership. Nor has there been much information on overall rail ridership on Brightline or Tri-Rail, two rail options that delivered fans to shuttles at stations. Tri-Rail's Miami Central Station recorded its two busiest days ever (since the station opened in January 2024) on June 24 and June 27 — but modest in absolute terms, just over 1,200 and 1,100 rides respectively.
Traffic jams, on the other hand, were well documented. On opening night, (Saudi Arabia-Uruguay, June 16) roads around the stadium were gridlocked as kickoff approached, and the stadium was slow to fill as thousands of empty seats were visible at kickoff; final attendance came in at 62,764, about 2,000 short of the venue's capacity despite parking having reportedly sold out in advance.
The Second match (Uruguay-Cape Verde, June 21) was worse and got national coverage. CBS Miami reported "hours of gridlock," fans searching for rideshares, streets blocked and rerouted, and residents' fences plastered with "no parking" signs as authorities scrambled to keep neighborhood streets clear. A representative quote captures the mood precisely: "We came with low expectations, and it was still bad, but slightly less bad than we thought."
Final Thoughts
The World Cup demonstrated that almost any stadium can host a successful mega-event if enough money, planning, and temporary infrastructure are devoted to it. The cities that truly distinguished themselves were those that required the least extraordinary intervention because decades of investment in transit, walkability, and urban form had already done much of the work.
But success and durability are not the same. The rail service and walkable neighborhoods that connect people to stadiums and surrounding attractions will persist for generations. On the other hand, temporary bus services are already gone. World Cup planners were generous with temporary infrastructure and stingy with permanent investment illuminating the limits of what mega events can accomplish and reminding us that there really is a difference between hosting an event and building a city.
