“We Made a Mistake” Six Ways to Fix the Urban Highway
This essay was researched and drafted in collaboration with Claude (Anthropic). The analysis, framing, and conclusions are my own. Links to sources are included so that readers can verify information supporting the case studies.
“We made a mistake.”
This is the verdict of the Atlas of Inner-City Highway Impacts, a research project lead by Urban Planner Patrick Kennedy that maps the consequences of the America’s 20th century decisions to extend the interstate highway system into 140 cities. While inter-city roads are necessary to link metropolitan areas and facilitate interstate commerce, intra-city highways have devalued nearby land and removed thousands of acres of real estate from the tax rolls while causing environmental, social, and economic damage along with traffic bottlenecks they were built to solve.
“Infrastructure does not have to exist in its current state forever. Nor should it.” Kennedy writes.
Many communities have arrived at this conclusion independently, one freeway and one neighborhood at a time. Planners, policy makers and advocates no longer see their highways as sacrosanct or immutable. How change is occurring varies from place to place, which helps us understand the range of possibilities.
I’m interested in exploring possibilities for change around transit stations. Part 1 of this series measured the scale of the problem and determined that almost ½ of all transit stations in the United States are located within ½ mile of a highway. Part 2 asked how this happened and discussed the competition between highways and transit routes for urban land. This post focuses on remedies. Using case studies and data and visuals from the National Transit Atlas, I document six paths to addressing community impacts caused by highways.
These interventions are on a continuum. At one end: full removal, where the freeway comes down and the land beneath it is returned to the city. At the other: deliberate co-existence, where the highway stays and the question becomes how to build something worth having alongside it. In between lie underground burial, land bridges, pedestrian crossings, and the reclamation of forsaken space. Each choice is a different bet on how much of the original harm can be undone, and at what price. Each approach reflects a different theory of the problem: what caused it, who it harmed, what justice or pragmatism or opportunity requires, and what is actually achievable given money, time, and political will. Together they suggest something useful for the planner, the advocate, or the community trying to figure out which path is theirs.
Freeways to Boulevards: The Cypress St. Viaduct and the Embarcadero
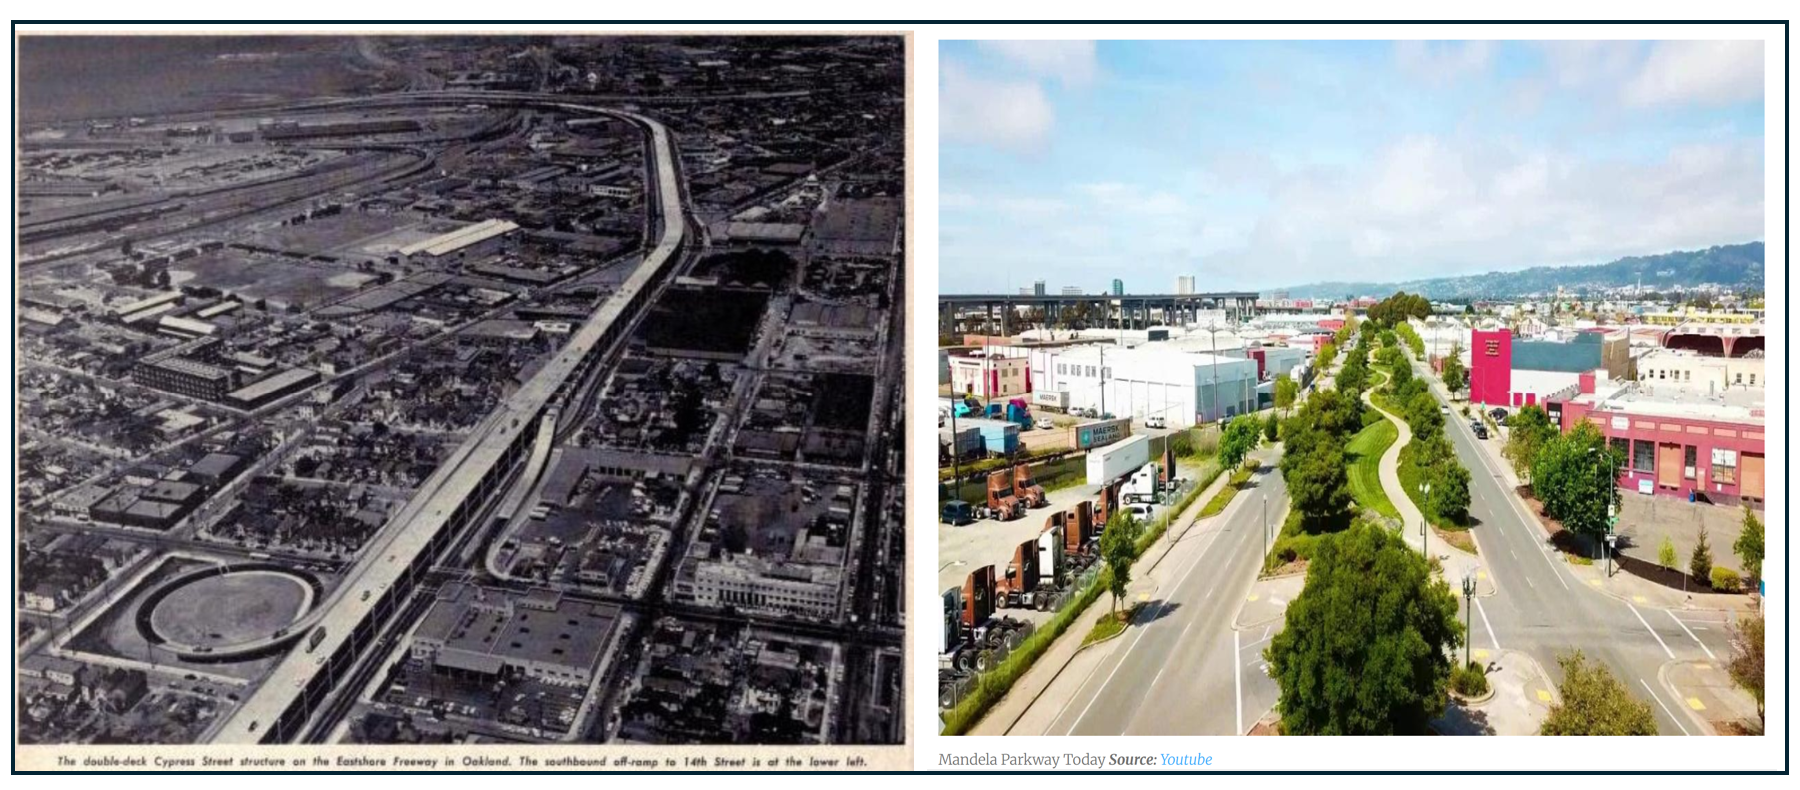
The original Cyprus Viaduct Product (left) and the Mandela Boulevard (right). Images from CNU
Background
The Cypress Street Viaduct opened in 1957 as the first double-decker freeway in California, part of Interstate 880. It replaced a single-deck road built in the 1930s in order to provide faster commutes to the Oakland-San Francisco Bay bridge. Both the original and expanded highways ran directly through the middle of the West Oakland neighborhood, cutting it in half and, together with Interstate 980 to the south, effectively encircling the community. Construction displaced over 600 families, and surrounding urban renewal projects destroyed over 5,000 residences in the predominantly Black and Latino neighborhood. CNU.
Timeline
On October 17, 1989, a magnitude 6.9 earthquake caused a large portion of the freeway's upper deck to collapse onto the lower deck, killing 42 people. Wikipedia The earthquake forced a freeway replacement decision the city had never been willing to make voluntarily. The original right-of-way was de-certified in 1991 TRID, and in 1997 the Nimitz Freeway was rebuilt and rerouted to loop around the area using a largely ground-level design. Kiddle. A street level boulevard, the Mandela Parkway, replaced the elevated freeway. Construction itself took approximately two years TRID, with the corridor largely complete by the early 2000s and the Mandela Gateway affordable housing project opening in 2005. Total elapsed time from earthquake to completed boulevard: roughly sixteen years.
Cost
The project has two distinct cost components. The Mandela Parkway construction, a 2-kilometer boulevard with a wide green median, bike lanes, and landscaping cost approximately $11.5 million (or aound $20 millin in today’s dollars). TRID The much larger cost was the replacement freeway: due to cost overruns, the costs of the replacement freeway doubled from initial estimates of $650 million to $1.2 billion, making the five-mile freeway replacement the most expensive of its kind at the time Wikipedia. The full project, in other words, cost over $1.2 billion — though the bulk of that was building the new freeway, not the boulevard itself.
Funding
Funding came primarily from state and federal highway sources through Caltrans, supplemented by federal earthquake relief and infrastructure appropriations. The replacement freeway's cost overruns were driven by land acquisition: Caltrans had to purchase land and property from Southern Pacific Railroad and Amtrak, move part of the rail yard, replace a USPS parking lot with a parking garage, replace BART support beams, and purchase land from the U.S. Army as the new freeway route went through the Oakland Army Base. En Academic
Challenges
Beyond the land acquisition complexity, the central challenge was political will, which the earthquake resolved involuntarily. After the collapse, the community pushed Caltrans into rerouting the freeway rather than rebuilding it in place. Segregationbydesign Without community pressure, Caltrans would likely have rebuilt the viaduct on its original footprint, as was standard practice after earthquake damage. The sixteen-year timeline from collapse to completed parkway reflects both the complexity of rerouting major highway infrastructure and the slow pace of community benefit work following the initial reconstruction.
Impacts and Public Reaction
The documented outcomes are striking. Annual nitrogen oxide levels around the parkway decreased by 38% and annual black carbon levels decreased by 25%. Approximately three dozen new businesses have sprung up around the parkway. The parkway also forms a critical link in the Bay Trail, a 500-mile walking and bicycle trail planned around San Francisco Bay. CNU.
At the same time, new market-rate housing now threatens to gentrify the area and further displace the existing community. Segregationbydesign Rising property values may be creating new displacement pressures where the old highway once suppressed them.
Transit Access: What the Data Shows
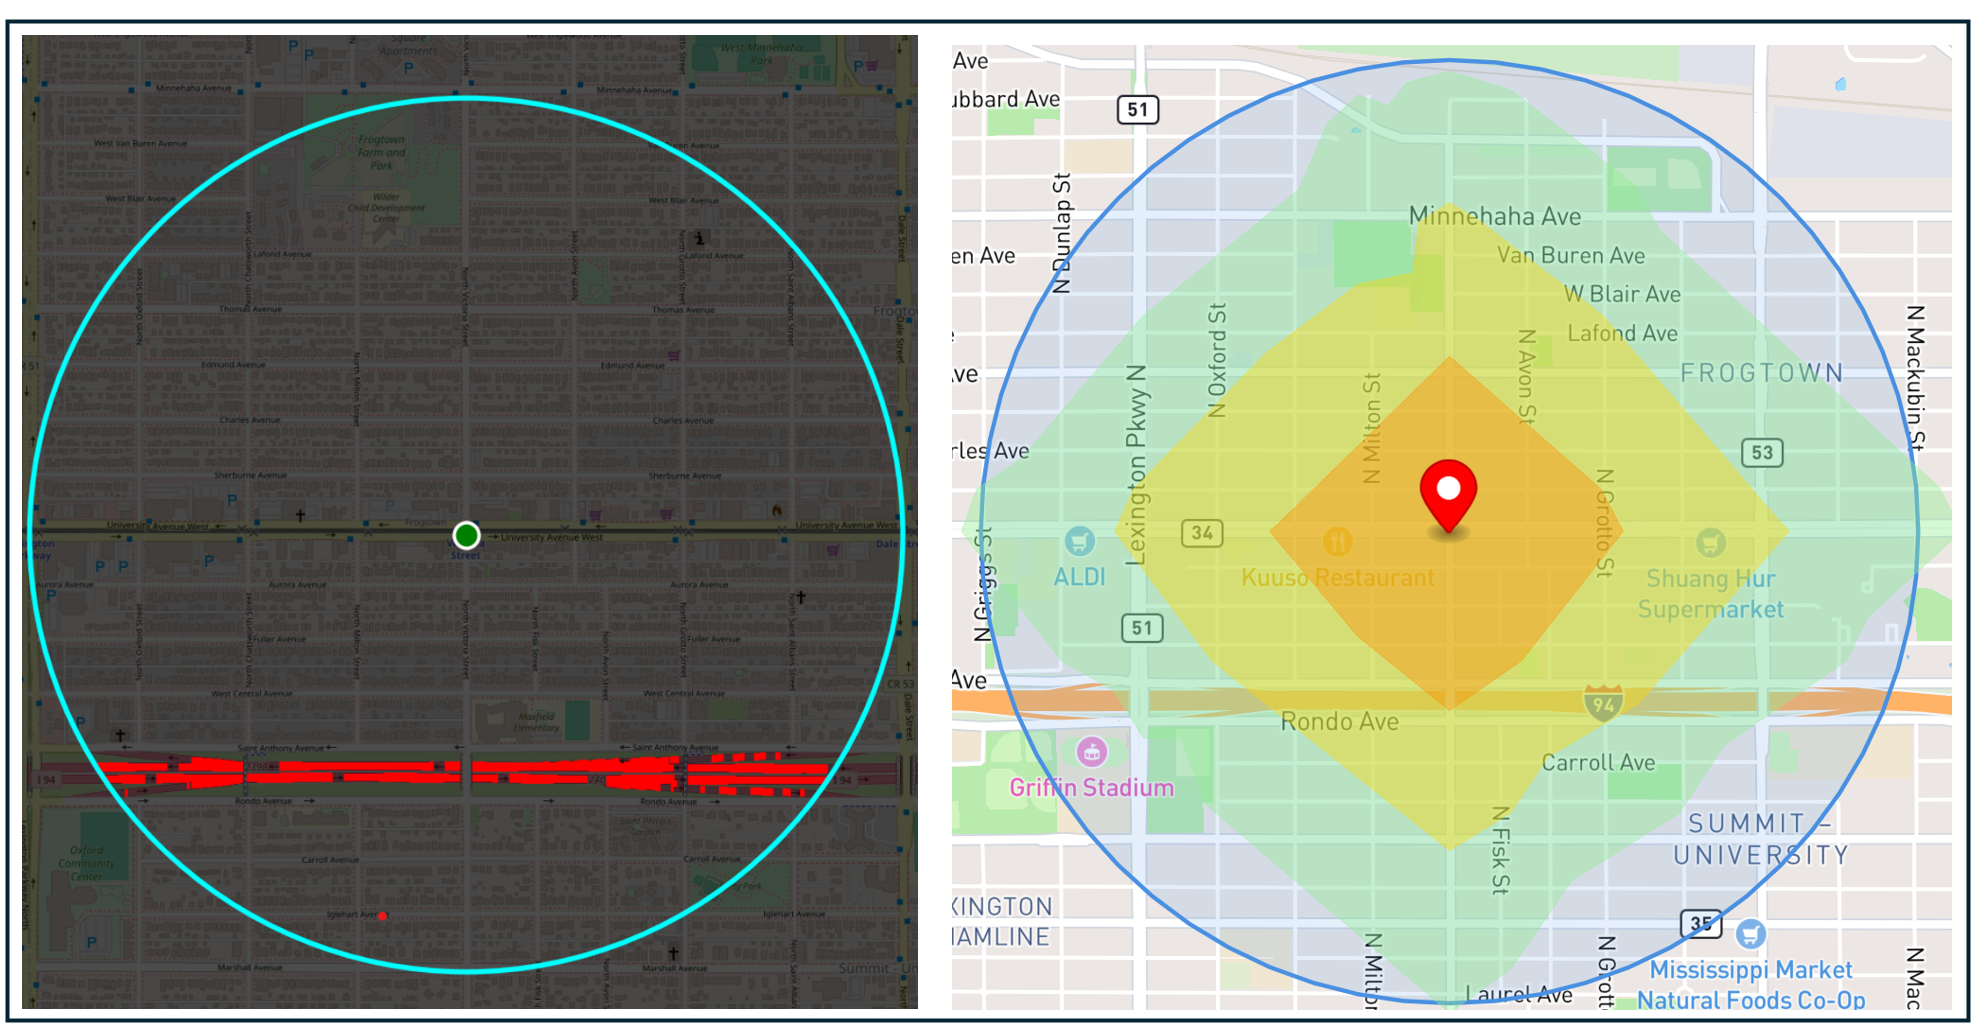
The West Oakland BART station sits at one of the parkway's key gateway nodes, a position that would have been nearly impossible to build around when the viaduct loomed overhead. The Atlas's walkshed analysis indicates most of the revitalized Mandela Parkway corridor falls within a 15-minute walk of the station, a meaningful expansion of what the viaduct allowed.
But the Atlas data also makes the limits of the transformation visible. Walkability in several directions from the station remains constrained — by the Nimitz Freeway, which was rerouted rather than removed, and by the rail yard that borders the neighborhood to the north. And within that imperfect walkshed, the land use picture has not kept pace with the transit opportunity: 61 parking lots and garages totaling 1.3 million square feet of car storage sit within steps of the station entrance, in a region facing one of the most acute housing shortages in the country. The freeway is gone. Its logic, embedded in decades of subsequent land use decisions, persists.
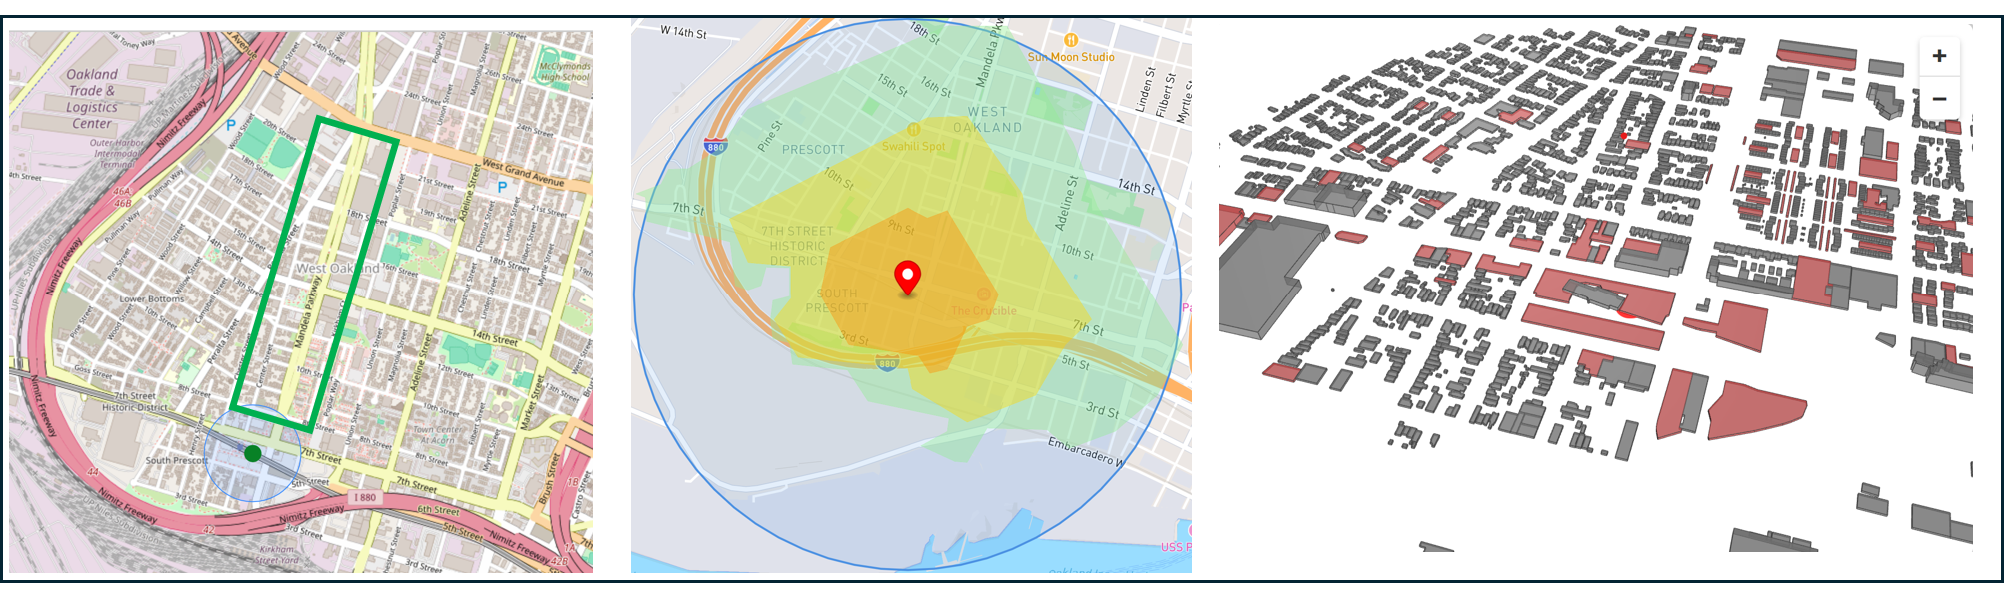
Lef: the Mandela Parkway, bordered in green, adjacent to the West Oakland BART station. Center: land accessible within a 5, 10, and 15 minute walk from the station shaded in orange, yellow, and green compared to the theoretical maximum distance a person could walk in any direction if no barriers existed (the light blue circle). Right: parking lots and garages (shown in red) within ½ mile of the station.
The Embarcedero
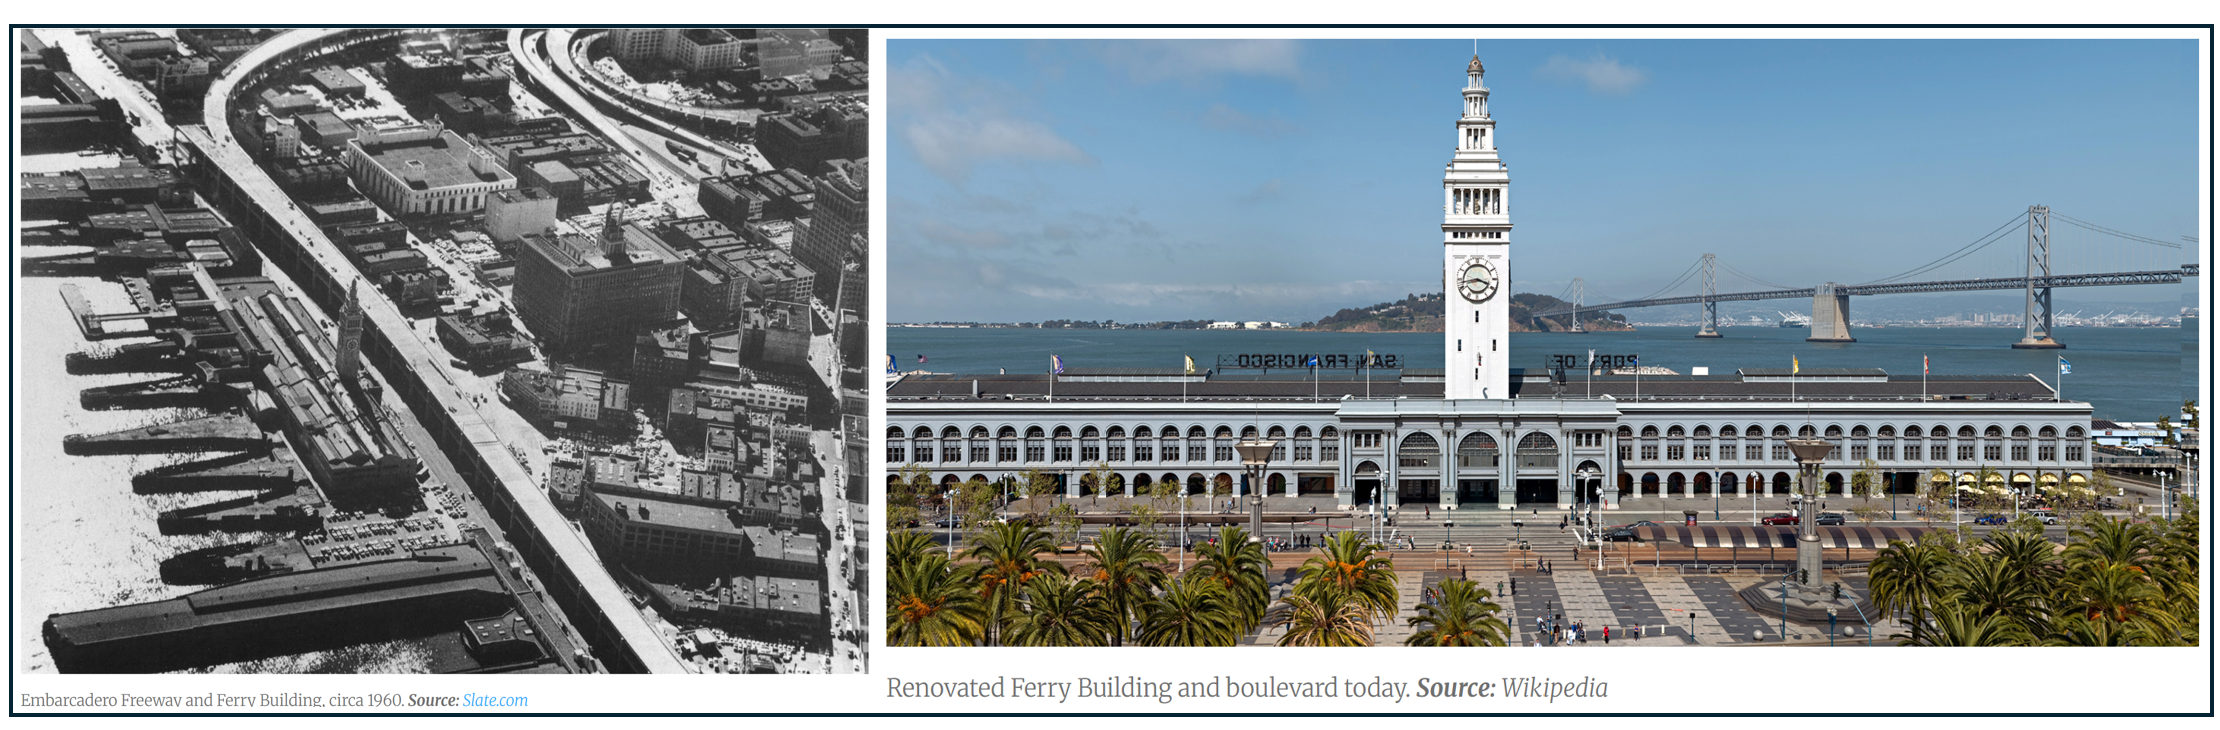
The elevated embarcadero freeway next to the Ferry Building (left) and the embarcadero boulevard adjacent to the renovated Ferry Building (right). Images from CNU
West Oakland and San Francisco share a bay and, as it happens, an earthquake. The same Loma Prieta tremor that brought down the Cypress Viaduct also damaged the Embarcadero Freeway eleven miles away and set in motion a remarkably similar sequence of events with one crucial difference. In West Oakland, the community had to fight Caltrans for the right not to rebuild in place. In San Francisco, the community had been fighting for removal for thirty years before the earthquake gave them their opening.
San Francisco's Embarcadero Freeway was originally designed to connect the Bay Bridge and the Golden Gate Bridge but was never completed. CNU The structure stood a massive 70 feet high and 52 feet wide, almost uncomprehendingly close to the front of the Ferry Building, physically cutting the northern waterfront off from the rest of the city. Subsequent architecture followed suit: buildings "turned their backs" to the freeway and the waterfront beyond. University of Washington.
Timeline
The Embarcadero Freeway was so hated that San Francisco prevented the original plan from being fully completed and then worked for a long time to get rid of it. Opensfhistory As early as 1973, then-Supervisor Dianne Feinstein had vowed "I'm determined that that freeway come down, if I have to become totally gray-haired in the process." Streetsblog Proposals to remove the structure were put before and rejected by San Francisco voters three times. University of Washington. The 1986 ballot measure — the most serious attempt — was rejected by a 58–42 margin. Streetsblog
The battle to demolish the Embarcadero had been struggling until the 1989 Loma Prieta earthquake damaged it beyond repair. CNU Removal began in 1990 and was complete by 1991. CNU The replacement boulevard, designed by ROMA Design Group, was built in 2002. CNU Total elapsed time from earthquake to completed boulevard: approximately thirteen years, though the political fight stretches back to the freeway's opening day in 1959, making the full arc closer to forty years.
Cost
The new Embarcadero boulevard cost $50 million to construct. Reclaimingoldwestbroad, a modest investment compared to the project’s impact in part because no freeway relocation was required. The structure was simply demolished and the surface street redesigned in its footprint.
Funding
The $171 million project, including demolition and boulevard construction, was paid for largely by the federal government, with $10 million paid by the city. Reclaimingoldwestbroad. Federal funding eligibility came through the 1973 amendment to the Federal Highway Act, which authorized cities to withdraw unfinished Interstate segments and redirect those funds to other transportation uses — a policy that made the Embarcadero conversion financially viable in a way it might not otherwise have been.
Challenges
The central challenge was political, not engineering. The freeway was damaged but not destroyed by the earthquake, meaning the city still had to make an active choice to remove it rather than retrofit it. Caltrans initially planned to retain and retrofit the freeway, and opposition to demolishing it mounted again, with over 20,000 signatures gathered in an attempt to require another city vote. Wikipedia The decisive factor was that the earthquake forced a natural experiment: with the freeway closed, traffic patterns appeared to self-correct, and the city ultimately decided that removal, rather than repair, was the best option. Reclaimingoldwestbroad. The feared gridlock never materialized, which broke the back of the opposition argument.
Impacts and Public Reaction
The outcomes have become the canonical argument for freeway-to-boulevard conversions. More than 100 acres of land along the waterfront that had once been dominated by the elevated freeway gave way to a new public plaza and waterfront promenade. The Ferry Building was redeveloped into a thriving public market. Housing in the area increased by 51% and jobs rose by 23%. CNU Property values in the area increased by 300% while traffic remained stable. Reclaimingoldwestbroad. Public reaction today is essentially unanimous approval, which makes the pre-earthquake political history all the more striking. The community that voted 58–42 to keep the freeway in 1986 had, by the time the boulevard was complete, largely forgotten that fight ever happened.
Transit Access: What the Data Shows
The transit outcomes here are the strongest of any case in this series, which is partly a function of San Francisco's transit density and partly a function of what the freeway had been doing. The elevated structure had severed connections between the waterfront transit infrastructure and the rest of the city. BART ridership at the adjacent station increased by 15% after the freeway closed. Muni's historic F-line streetcar now runs the full length of the boulevard. Five light rail stops occupy the corridor where the freeway once stood.
The Embarcadero's conversion from a highway barrier to a crossable street restored the connective tissue between transit modes. Ferry terminals, BART, Muni streetcar, and the pedestrian network became legible to each other in a way they hadn't been since the freeway was built. The Atlas's barrier analysis, which measures how much of a station's walkable catchment is consumed by highway infrastructure, would show near-total elimination of that constraint along the waterfront corridor. That's not a modest improvement. It's a different city.
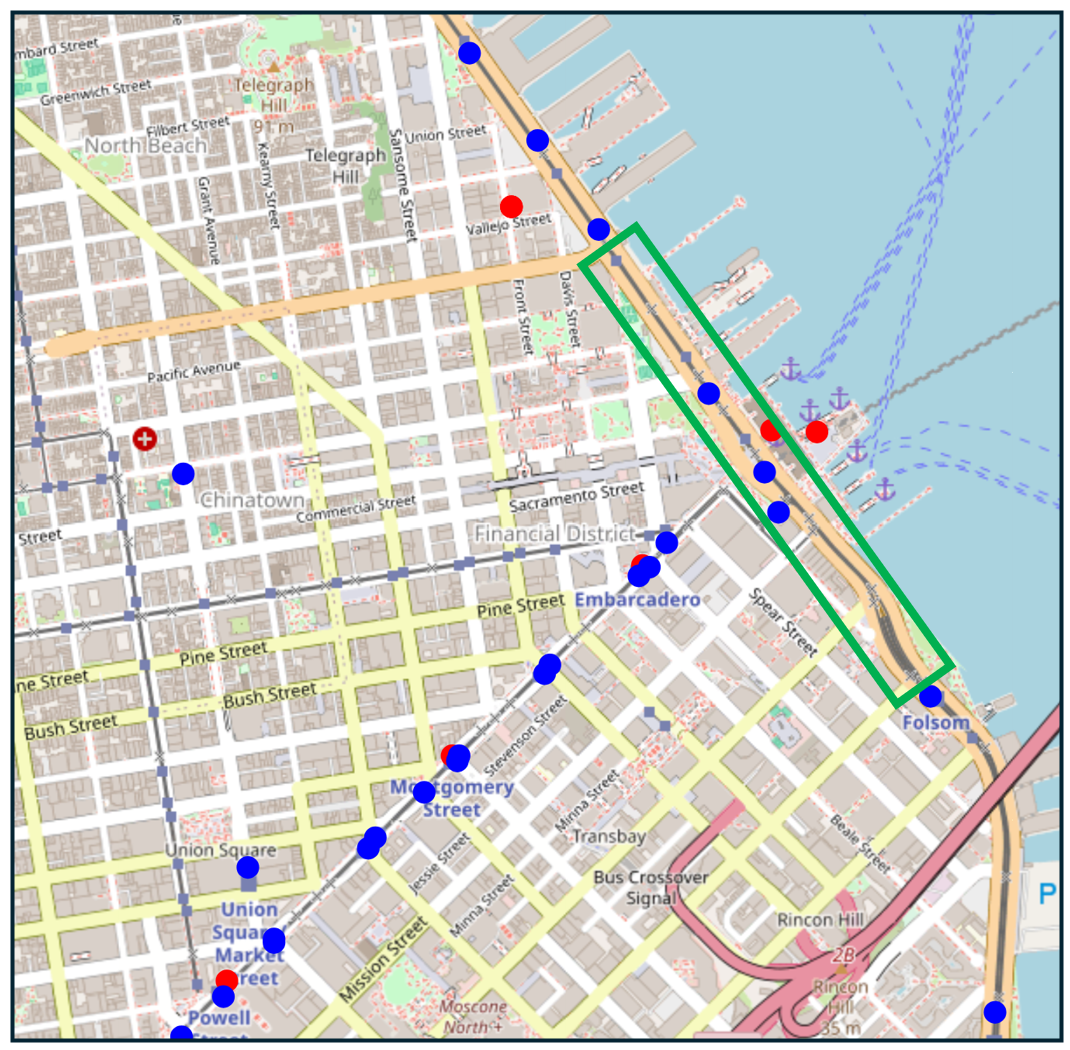
An image of downtown San Francisco with the Embarcadero highlighted in green. Blue dots represent Muni stations and red dots represent transit stations operated by other agencies.
Underground Relocation: The “Big Dig”
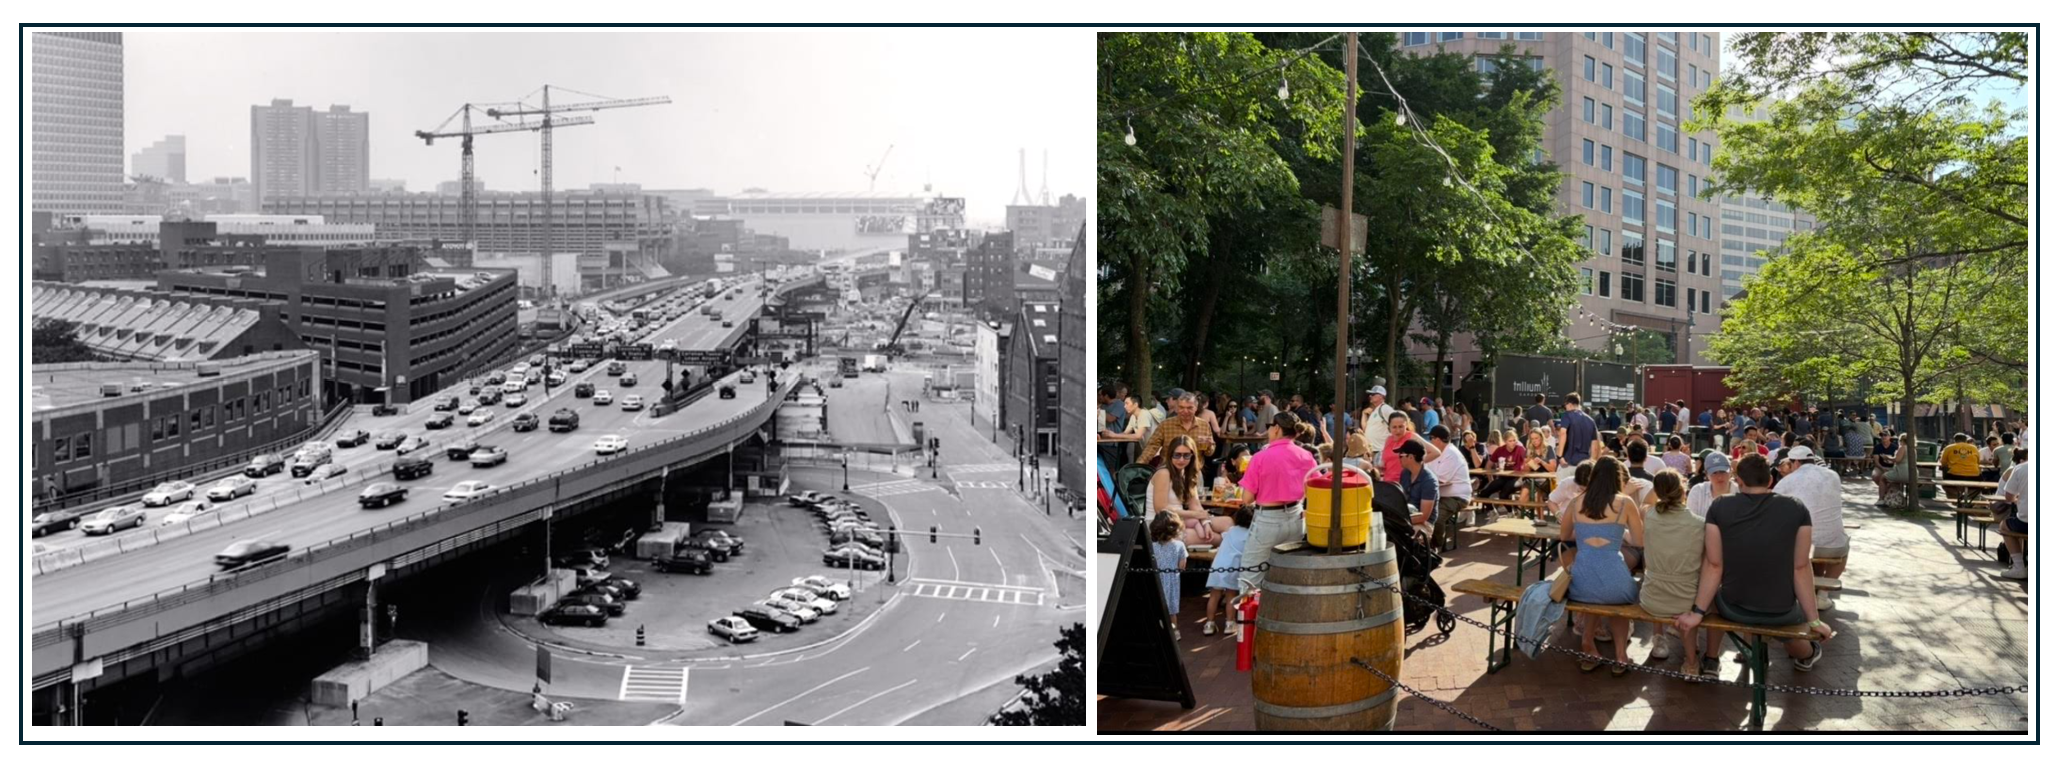
Left: people in cars traveling on the elevated central artery source. Right: people not in cars enjoying the Rose Kennedy Greenway (photo by the author)
Background
West Oakland got a boulevard. San Francisco got a waterfront. Boston got a hole in the ground — and spent twenty-five years and $24 billion digging it.
Boston’s elevated Central Artery was constructed between 1950 and 1959. It was conceived as a spine running through the heart of the city to speed traffic between the northern and southern suburbs and reduce traffic congestion downtown. The elevated highway had displaced 20,000 residents during its original construction and cut off the North End and Waterfront neighborhoods from downtown, limiting their ability to take part in the city's economic life. Mass.gov. By the early 1970s it was already obsolete. The highway had been designed for around 75,000 vehicles per day; by the time demolition planning began in earnest it was carrying nearly three times that volume. The structure also had no shoulders and weave points that created endemic backups. It was essentially a design failure within fifteen years of opening.
Timeline
The Big Dig replaced the Central Artery (I-93) with an underground highway, two new bridges over the Charles River, and an extension of I-90 to Logan International Airport, and a package of public transportation projects. Planning began in 1982. In 1987, after years of extensive lobbying for federal dollars, a public works bill appropriating funding was passed by Congress but vetoed by President Reagan for being too expensive. When Congress overrode the veto, the project had its green light. Wikipedia Construction began in September 1991. Mass.gov The project was originally scheduled to be complete by 1998. Construction finished in 2006, eight years behind schedule, and the project formally concluded in December 2007. U.S. National Park Service Total elapsed time from initial planning to completion: twenty-five years.
Cost
The cost story is the Big Dig's most infamous chapter. The original cost estimate was $2.56 billion in 1982 dollars. By 1992, it had risen to $7.74 billion; by 1994, to $10.4 billion; and the final construction cost reached $14.78 billion. PMI But even that figure understates the true burden. The state used $7 billion in federal aid and borrowed the rest; adding interest, the total figure shouldered by state and federal taxes and tolls will reach $21 billion by the time the final bond is paid off in 2038. Boston.com Add legally mandated transit mitigation commitments and the total climbs to approximately $24 billion (a figure that would exceed $39 billion in today’s dollars) making it the most expensive transportation mega project in American history, surpassing the cost of the Hubble Space Telescope, the Large Hadron Collider, and the Channel Tunnel.
Funding
The project was funded through a complex mixture of federal highway dollars, state bonds, and toll revenue. Federal aid covered approximately half the final construction cost, though federal support was capped as project costs spiraled, shifting an ever-larger share to the state. Boston.com Critically, under the Federal Clean Air Act, Massachusetts was required to mitigate air pollution generated by the highway improvements. Secretary of Transportation Fred Salvucci signed an agreement with the Conservation Law Foundation in 1990 enumerating 14 specific transit projects the state agreed to build, Wikipedia including restoration of three Old Colony commuter rail lines, the Silver Line BRT to the South Boston waterfront, Blue Line modernization, and commuter rail expansion to Worcester. Transit work completed so far has resulted in $1.7 billion in construction costs and $1.6 billion more in interest. Boston.com Some commitments — most notably the Red-Blue Line connector — remain unbuilt as of 2023. Wikipedia
Challenges
The challenges were encyclopedic. The most significant cost drivers were the failure to properly assess unknown subsurface conditions, unanticipated environmental and mitigation costs, inflation, and expanded scope. The mitigation alone required 1,500 separate mitigation agreements, all of them unanticipated. PMI The project involved constructing tunnels beneath a densely built downtown while keeping the existing elevated highway operational — an engineering constraint that forced construction sequencing of extraordinary complexity. The project spanned 7.8 miles of highway and 161 lane-miles, about half in tunnels, placing 3.8 million cubic yards of concrete and excavating more than 16 million cubic yards of soil. Interesting Engineering Quality control failures culminated in a fatal incident: in 2006, a portion of concrete ceiling panels in the I-90 tunnel collapsed, killing a motorist, Secret Boston Media exposing systematic construction defects and triggering a wave of litigation and emergency inspections. One National Academies review concluded bluntly that early cost estimates were deliberately optimistic: "politically, they had no choice — if they'd been honest, the project never would have happened." National Academies
Impacts and Public Reaction
Despite its troubled history, the outcomes have been transformative. The project created more than 300 acres of open land while reconnecting downtown Boston to the waterfront. Mass.gov That land became the Rose Kennedy Greenway, a mile-and-a-half linear park threading through the heart of downtown where the elevated highway once stood. Carbon emissions in Boston dropped by 12% because cars were moving instead of idling in traffic. U.S. National Park Service The iconic Zakim Bridge has become a symbol of the city. The mandatory transit investments, though contested and incomplete, represent one of the largest transit mitigation packages ever extracted from a highway project.
Public reaction has been predictably divided along a time axis. During construction, the Big Dig was a byword for government incompetence and contractor fraud. Today, it is broadly regarded as a success — a "superb facility that has improved the quality of life in Boston as well as the transportation function for the entire region," Boston.com even as the debt payments continue for another decade. The honest assessment is both things simultaneously: a genuine urban transformation achieved at a price that would be politically impossible to replicate anywhere today. The Big Dig is both the gold standard for highway transformation projects and a big driver of contemporary cynicism and mistrust over public works implementation.
Transit Access: What the Data Shows
The Big Dig’s transit outcomes parallel what we saw at the Embarcadero. The Central Artery's removal restored pedestrian connectivity across a corridor that had been severed for fifty years. The barrier analysis shows most of the roads adjacent to the Aquarium Station reclassified from freeway-level obstacles to crossable streets in the Big Dig corridor, with only the few sections where the Central Artery surfaces from underground registering as hard barriers. Sixteen MBTA transit stations fall within walking distance of the Rose Kennedy Greenway, along with ferry stops connecting to neighborhoods across Boston Harbor.
The comparison to the Embarcadero is instructive here, as it was on cost. Both projects eliminated elevated freeways from downtown waterfronts and restored pedestrian connections to transit networks that had been functionally isolated. The Embarcadero did it for $171 million by removing the structure entirely. Boston did it for $24 billion by moving the structure underground. The transit outcomes, by the Atlas measures, are roughly comparable. Whether that difference in cost reflects a difference in civic ambition, political constraints, or simple geography is a question the data can frame but can't answer.
What the data can say is this: underground relocation preserves highway capacity while reclaiming surface land. It is the costliest point on the spectrum, and the one that asks the least of drivers.
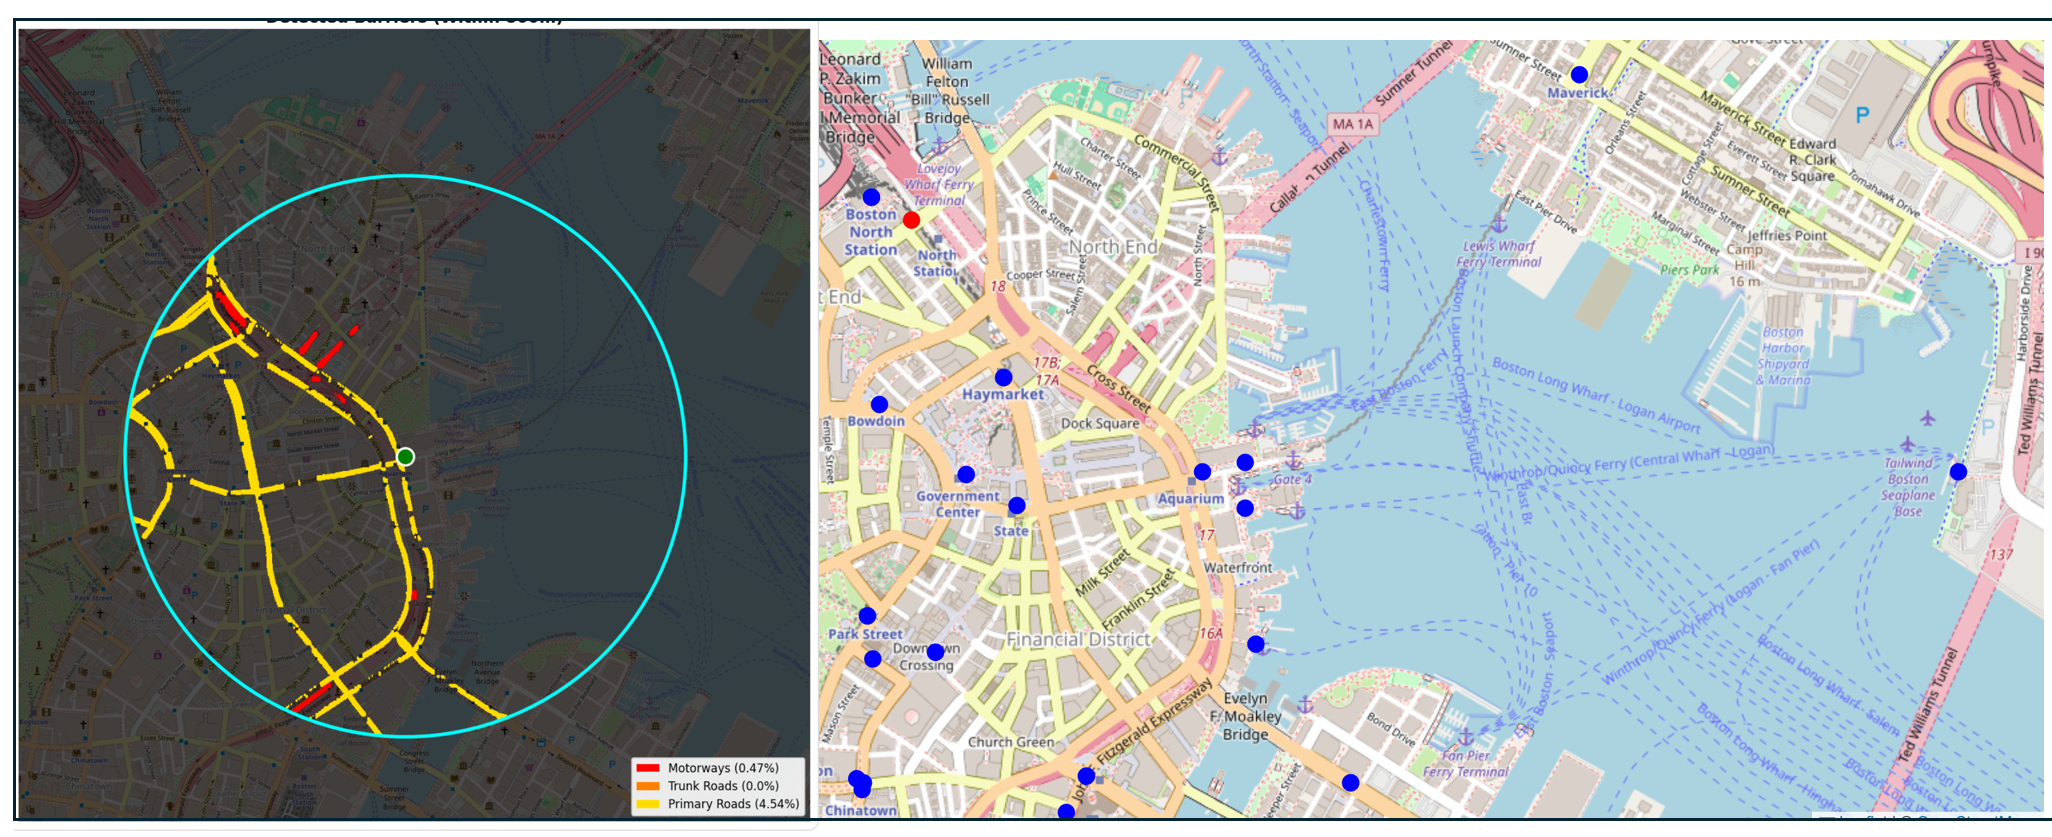
Left: National Transit Atlas image that classifies most of the roads adjacent to the Aquarium Station as “crossable barriers” (instead of freeways) in the area of the “big dig” (the few portions shown in bright red are where the Central Artery emerges from below ground). Right: sixteen MBTA transit stations within walking distance of the Rose Kennedy Greenway, as well as connecting ferry stops across the Boston Harbor
Cap and Cover: The Rondo Land Bridge
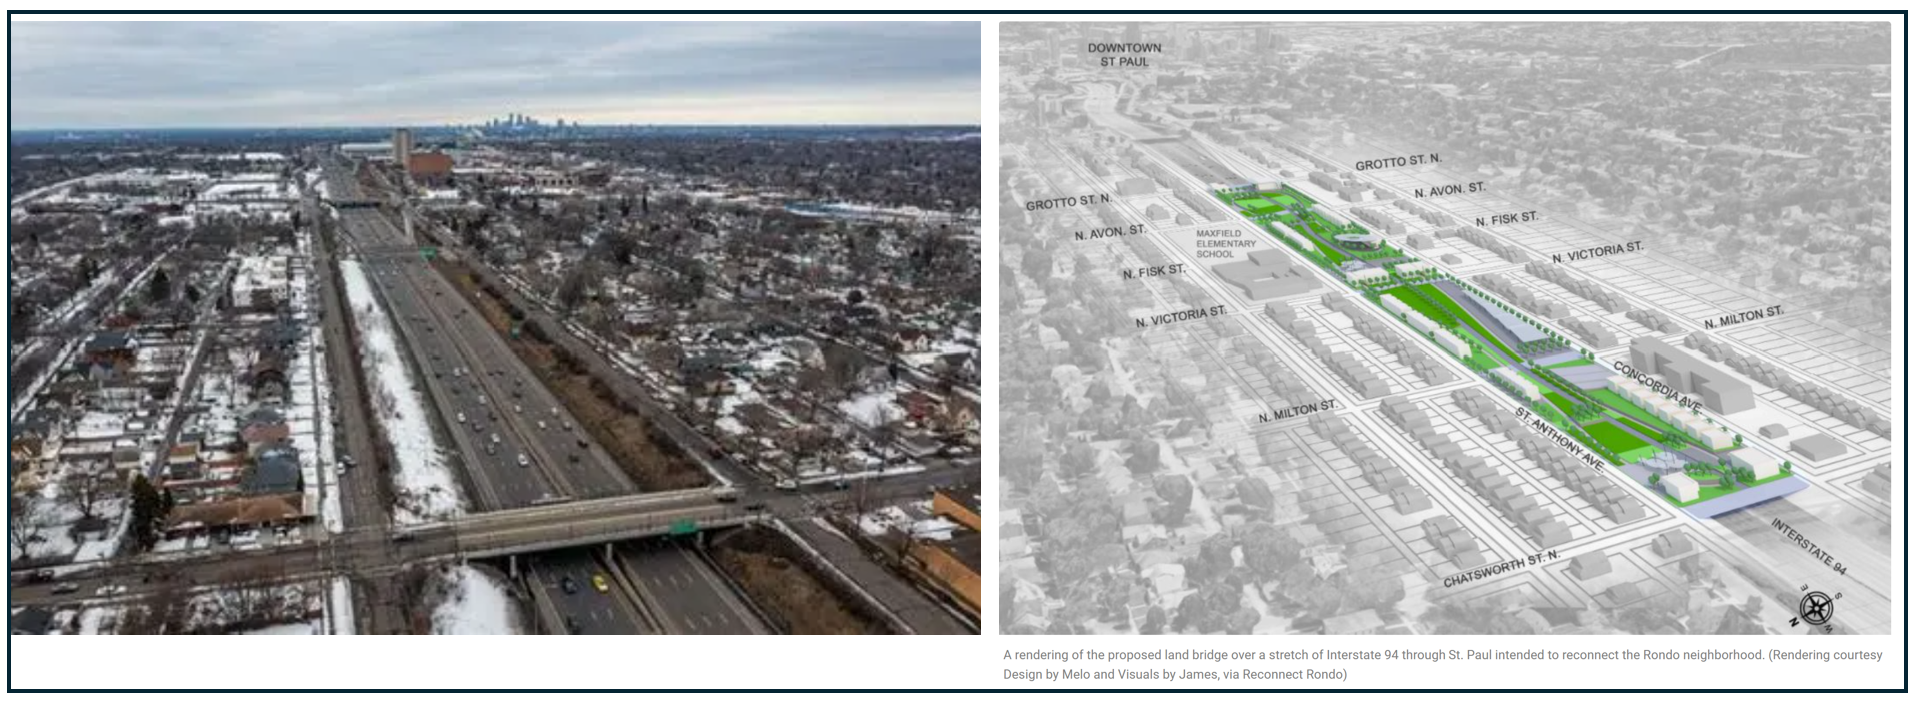
Left: a portion of Interstate I-94 through St. Paul source. Right: a rendering of the Rondo Land Bridge (right). Source: Reconnect Rondo.
Background
St. Paul's Rondo neighborhood was once a thriving middle-class community that 80% of the city's African American residents called home. Minnesota House of Representatives. In the 1950s, planners designed and constructed a 13-mile segment of Interstate-94 that connected between the downtown business corridors of Minneapolis and St. Paul. I-94 bisected the neighborhood, destroying about 700 homes and the home equity their owners had accrued, driving out 300 businesses and 61% of Rondo's residents. Minnesota House of Representatives The wound was compounded by a second displacement in the 1970s, when urban renewal demolished hundreds of additional homes on the freeway's flanks. Unlike the Embarcadero or West Oakland, where earthquakes forced decisions that politics had blocked, or in Boston, when highway engineering failures forced debate about alternatives, Rondo never got its moment of reckoning. Decades passed with the freeway simply there, a concrete trench running through what had been the civic heart of Black St. Paul.
The land bridge idea emerged indirectly from a transit fight. When the Central Corridor light rail line (now the Green Line) was proposed in 2009, there were no stops in Rondo. The idea emerged then: "Not only do we want stops, why not replace the land that was taken in the 1950s." Monitorsaintpaul The nonprofit ReConnect Rondo has led the effort since, envisioning an African American Cultural Enterprise District with community-owned housing, businesses, and green space built on reclaimed land.
Timeline
Serious community discussions began in earnest around 2015, when the idea of a cap or land bridge over I-94 was born ReConnect Rondo. A 2018 Urban Land Institute advisory panel validated the concept and recommended creating up to 21 acres of new land. In 2021, the Minnesota Legislature appropriated $6.2 million for project development, Bring Me The News marking the first public funding commitment. In 2023, ReConnect Rondo received a $2 million federal grant from the Reconnecting Communities Pilot program, and a further $2 million federal grant followed in 2024. Star Tribune The project is currently completing environmental assessment and master planning.
ReConnect Rondo has described a four-phase timeline: completing studies through roughly 2024–2025, firming up financing and development commitments between 2024 and 2026, with construction starting as soon as 2026 MinnPost — though that timeline has slipped as planning has continued. A final construction start date depends heavily on MnDOT's parallel "Rethinking I-94" process, which is evaluating the freeway's future on the full 7.5-mile corridor between Minneapolis and St. Paul. MnDOT has confirmed that any of its six current alternatives for the corridor could accommodate a land bridge. Minnesota House of Representatives If construction begins in the late 2020s, the arc from first community discussions to ribbon-cutting would span roughly fifteen years.
Cost
Early cost estimates topped $450 million for the structure itself. Star Tribune Planning and pre-development work is estimated to cost between $13 million and $15 million. Star Tribune To date, ReConnect Rondo has received $6.7 million in state funds and $4 million in federal grants for planning and pre-development. Bring Me The News No construction funding has been secured. At roughly $450 million, the land bridge would cost less than 4% of the Big Dig — but the comparison also highlights the gap in ambition: this is a half-mile cap over a neighborhood freeway, not a regional megaproject.
The comparison to the Big Dig is clarifying in both directions. At $450 million, the Rondo land bridge would cost less than 4% of Boston's underground relocation — a reflection of the difference in scale and ambition, but also a reminder that even a modest cap over a neighborhood freeway represents a major financial commitment for a state-level project. San Francisco spent $171 million (or $340-350 million in today's dollars) to remove an elevated structure and reclaim 100 acres of waterfront. Rondo would spend roughly 1.3 times that to create 21 acres of new land over a sunken freeway that will continue to operate beneath it. The cost per acre of reclaimed land is dramatically higher, and the highway, unlike the Embarcadero, does not go away.
Funding
ReConnect Rondo has pursued a diversified funding strategy from the outset, targeting federal highway and community development programs, state bonding dollars, private development investment, and philanthropic sources. The federal Reconnecting Communities Pilot program — created by the 2021 Bipartisan Infrastructure Law specifically to address the legacy of highway displacement in communities of color — has been the primary federal vehicle. However, the project has always been sold on the notion that costs will be split between state and federal government, and with federal funding for such programs now uncertain, opponents argue the entire cost could fall on Minnesota taxpayers. American Experiment A 2025 bill in the Minnesota House sought to prohibit MnDOT and the Metropolitan Council from spending any further funds on the project, citing the state's projected budget deficit — a direct signal of the political vulnerability that comes with depending on discretionary federal programs in a shifting fiscal environment.
Challenges
The project faces three overlapping challenges. The first is financial: $450 million is a large commitment for a state-level project without a committed federal partner, and the Reconnecting Communities program that funded planning work faces an uncertain future. The second is coordination: the land bridge's design must align with MnDOT's broader Rethinking I-94 process, which has its own timeline, stakeholders, and range of options — including full freeway removal, which some community members prefer over capping.
The third challenge is the one that cuts deepest, and it connects directly to what we saw in West Oakland. Reclaiming land has a way of raising its value. Raised land values have a way of displacing the people who fought for the reclamation. ReConnect Rondo has tried to get ahead of this dynamic by establishing a Rondo Restorative Development Authority, commissioning anti-displacement studies, and structuring the vision around community ownership rather than market-rate development. Whether those mechanisms will be sufficient is genuinely unknown.
Impacts and Public Reaction
The project has not yet been built, so impacts are projected rather than measured. ReConnect Rondo estimates the land bridge would create hundreds of new housing units, significant office and commercial space, up to 1,800 new jobs, and over $3.8 million in new annual city tax revenue. Community support within Rondo has been strong and emotionally resonant. The project is framed as restorative justice, not just urban planning, and the political coalition includes the St. Paul mayor, Ramsey County, MnDOT, and both U.S. senators from Minnesota.
Opposition has come primarily from fiscal conservatives and from a subset of community members who argue that capping the freeway is a compromise when full removal would be the more just outcome. That tension reflects something real: a land bridge leaves I-94 in place, rumbling beneath the new neighborhood, while full removal would return those 32+ acres of right-of-way to the street grid entirely. As ReConnect Rondo's executive director Keith Baker has acknowledged, the land bridge preceded the removal conversation and the two visions are not fully reconciled.
Transit Access: What the Data Shows
Three Green Line light rail stations sit immediately north of the proposed land bridge, and three B-Line bus rapid transit stations anchor the corridor to the south. The transit infrastructure, in other words, is already there. What the freeway trench has done is compress the effective walkshed of those stations on their southern flank — the Atlas's isochrone analysis shows that portions of the neighborhoods south of I-94 currently fall outside the ten-minute walkshed of Victoria Station, not because the distance is too great but because the crossing points are limited.
The land bridge would most likely pull those southern neighborhoods within a five-minute walk of the station. That is a meaningful gain. But it is worth being precise about what the land bridge is primarily for: it is an act of restorative development, an attempt to regenerate what was taken, not principally a transit access project. The transit benefit is real. It is also, in the hierarchy of ReConnect Rondo's objectives, secondary. A community that lost 700 homes and 300 businesses to a freeway is not primarily asking for a better walkshed. It is asking for its neighborhood back.
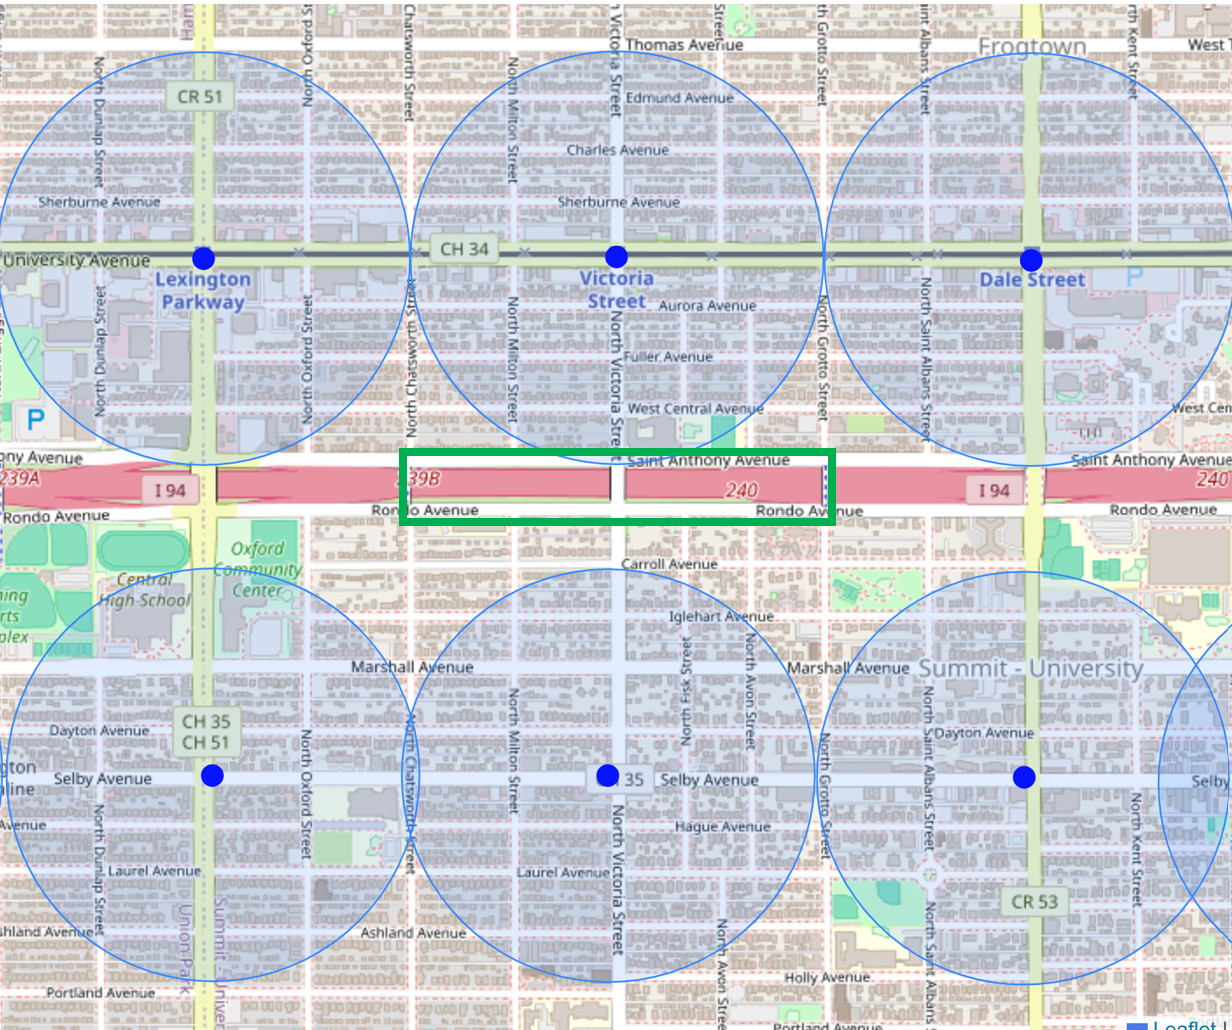
Image from the National Transit Station Atlas identifying transit stations close to the proposed Rondo Land Bridge. The circles indicate a ¼ mile from the station.
Left: National Transit Station Atlas identifying at least 44,802 square meters of land occupied by highways within ½ mile of the Victoria Station. Right: the Victoria Station walkshed map indicating that 73.6% of the land theoretically available within a 15-minute walk is actually walkable within 15 minutes.
Bridging the Lanes: The John Lewis Bridge over I-5
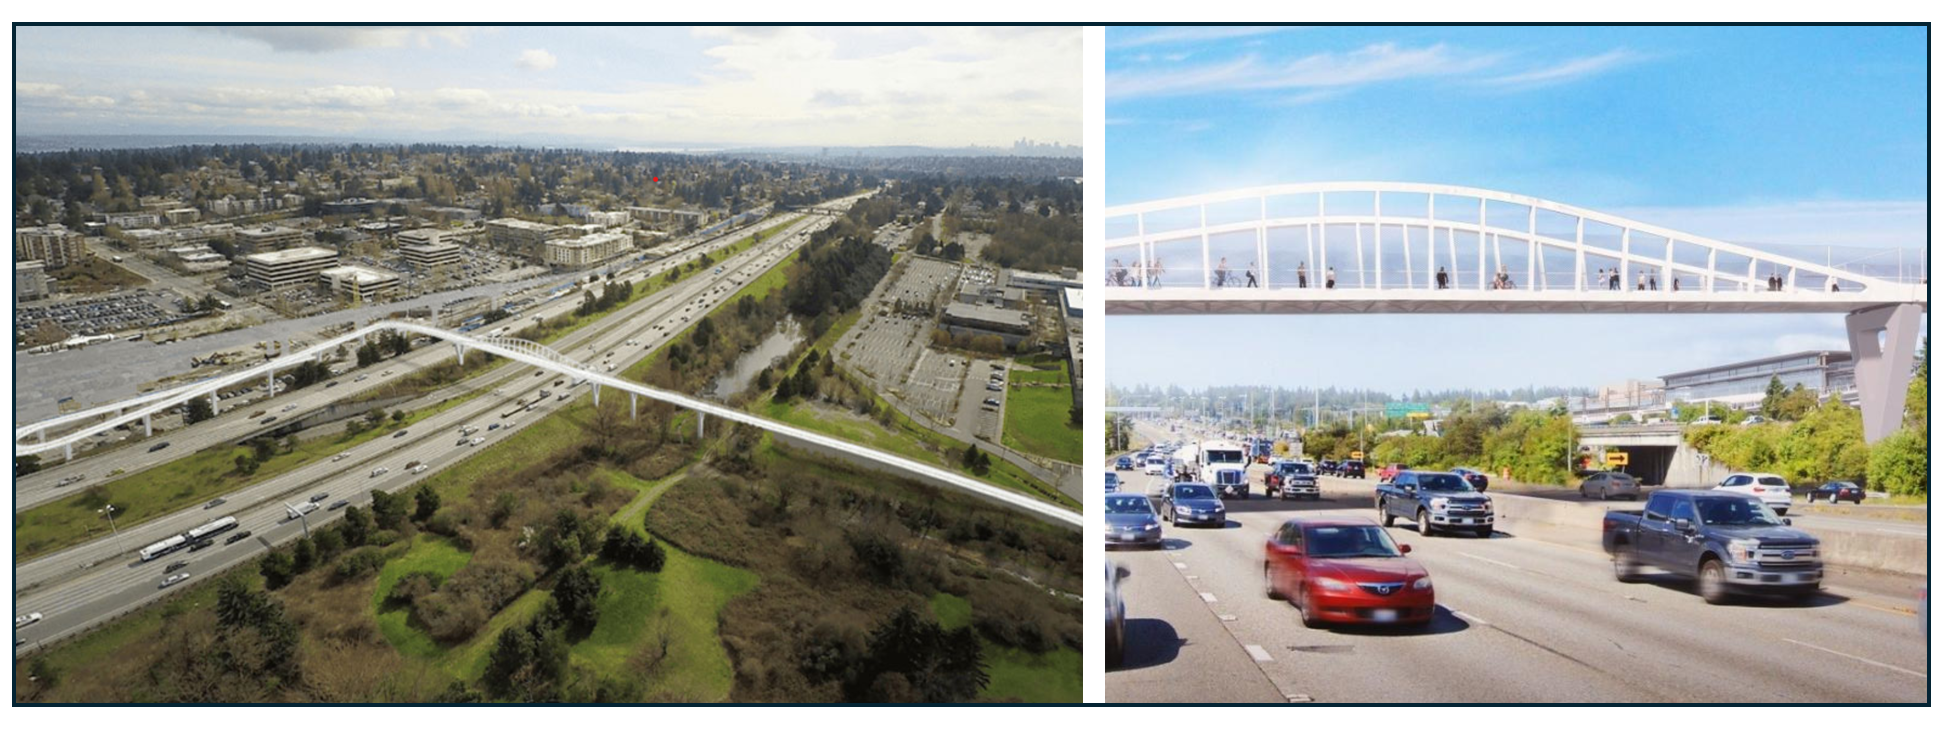
Images and renderings of the John Lewis Bridge spanning Interstate-5. Source: Cmdesign-sea
Background
The John Lewis Bridge is the leanest intervention in this series: no freeway removed, no highway buried, no new land created over a concrete trench. The bridge does one thing: it gets people across. But in the right circumstances, that single act can unlock something much larger than its footprint suggests.
Until the bridge opened, I-5 was an impenetrable, 10-lane barrier between Licton Springs and North Seattle College on the west side of the highway, and the communities and attractions to the east: the Northgate Urban Center, the Maple Leaf neighborhood, a community center and library, and many retail outlets. Cascade Bicycle Club The walk between North Seattle College and the existing transit center was 25 minutes or more. North Seattle College The transit stakes were specific and high: Sound Transit's Northgate Link light rail extension was under construction during the bridge's planning years, meaning that neighborhoods west of I-5 stood to gain a major new regional connection — but only if they could actually get across the freeway to reach it. Without the bridge, thousands of residents, students, and workers in Licton Springs would have been within a mile of a light rail station they could not practically reach on foot.
The bridge connects the campus of North Seattle College west of I-5 to the King County Transit Center and the new Sound Transit Link light rail station on the east side. Cmdesign-sea It was deliberately opened on the same day as Northgate Station — October 2, 2021 — making the infrastructure and transit access available simultaneously rather than leaving a gap between them.
Timeline
Planning began in 2014. KlikUSA The project nearly didn't survive that planning phase: Sound Transit proposed cutting the bridge from the Northgate expansion and instead building a massive parking garage to enable more people to drive to Northgate. Cascade Bicycle Club, alongside allied community groups, rallied public support by turning out large numbers of community members to speak at public hearings and write letters, creating political pressure to defeat the parking garage plan and get the bridge built. Cascade Bicycle Club.
The project was restarted in 2016 with a new team led by the Seattle Department of Transportation, Aiawa which developed a redesigned concept that fit the available budget. Construction ran from roughly 2019 through 2021, and the bridge opened on October 2, 2021. Seattle Department of Transportation Total elapsed time from initial feasibility study to opening: approximately seven years — relatively fast for infrastructure of this complexity, and a direct result of the bridge being tightly coupled with the light rail expansion timeline.
Cost
The bridge cost $56 million — roughly one-eighth the projected cost of the Rondo Land Bridge, and less than half a percent of the Big Dig. That comparison illuminates the spectrum as clearly as any single data point in this series. The interventions that reclaim land and address the underlying highway barrier cost orders of magnitude more than the interventions that simply create a way across. The John Lewis Bridge does not pretend to undo what I-5 did to the surrounding neighborhoods. It creates a door in the wall. The door cost $56 million. Removing the wall would cost something closer to what Boston spent and would require a political will that most communities cannot generate without a crisis.
Funding
Funding was secured from multiple sources, including SDOT, Sound Transit, Washington State, and additional local funds. The project was supported by the nine-year Levy to Move Seattle, approved by voters in 2015. Seattle Department of Transportation Sound Transit invested $10 million in the bridge specifically because of its role in making the Northgate Link station accessible. SDOT Blog The Connecting Washington state transportation funding package, secured in 2015 with advocacy support from Cascade Bicycle Club and Washington Bikes, provided additional state dollars. The multi-agency structure — SDOT, WSDOT, Sound Transit, and King County Metro all contributed — reflects both the bridge's complexity and the political work required to assemble funding for infrastructure that doesn't fit neatly into any single agency's mission.
Challenges
The primary challenge was political rather than technical: keeping the bridge alive when Sound Transit proposed replacing it with a parking garage. Once that fight was won, the engineering challenges were substantial but manageable. The site sits in the upper reaches of Thornton Creek, an urban watershed draining into Lake Washington, requiring extensive environmental mitigation. Mitigation was required to address project impacts on fish habitat and riparian functions for connected watercourses, wetlands, and wetland buffers on both sides of I-5, with a combination of on-site and off-site wetland creation, restoration, and enhancement. Aiawa The bridge also had to span a ten-lane active interstate during a brief weekend closure for girder placement — a logistical constraint that shaped the entire construction sequencing. The project planted over 450 new trees, five times as many as were removed during construction. SDOT Blog
Impacts and Public Reaction
The bridge opened to immediate and enthusiastic use. Projections called for 1,500 daily walkers, wheelchair users, and cyclists. KlikUSA The opening-day event drew over 1,500 people crossing the bridge, with many arriving via the simultaneously-opened Northgate light rail station. The project received the TransitCenter Frequencies Award for Best Transit Expansion of 2021 — recognition that acknowledged the bridge as an integral part of the transit expansion rather than a separate project.
The naming carries its own significance. Councilmember Debora Juarez led the effort to name the bridge after John Lewis to increase BIPOC representation in North Seattle's public infrastructure, noting that BIPOC community members and leaders are underrepresented in the names of significant city infrastructure. The Skanner News The choice connects the bridge's functional purpose — crossing a barrier to reach opportunity — with the civil rights legacy of its namesake, who led marchers across the Edmund Pettus Bridge in Selma.
Transit Access: What the Data Shows
The John Lewis Bridge has one job, and the Atlas data shows it doing that job with precision. Before the bridge opened, the walkshed analysis for Northgate Station showed a hard truncation on its western flank — the ten lanes of I-5 compressing what should have been a fifteen-minute walking circle into something closer to a crescent. After the bridge, a substantial portion of Licton Springs and the North Seattle College campus falls within a fifteen-minute walk of the station.
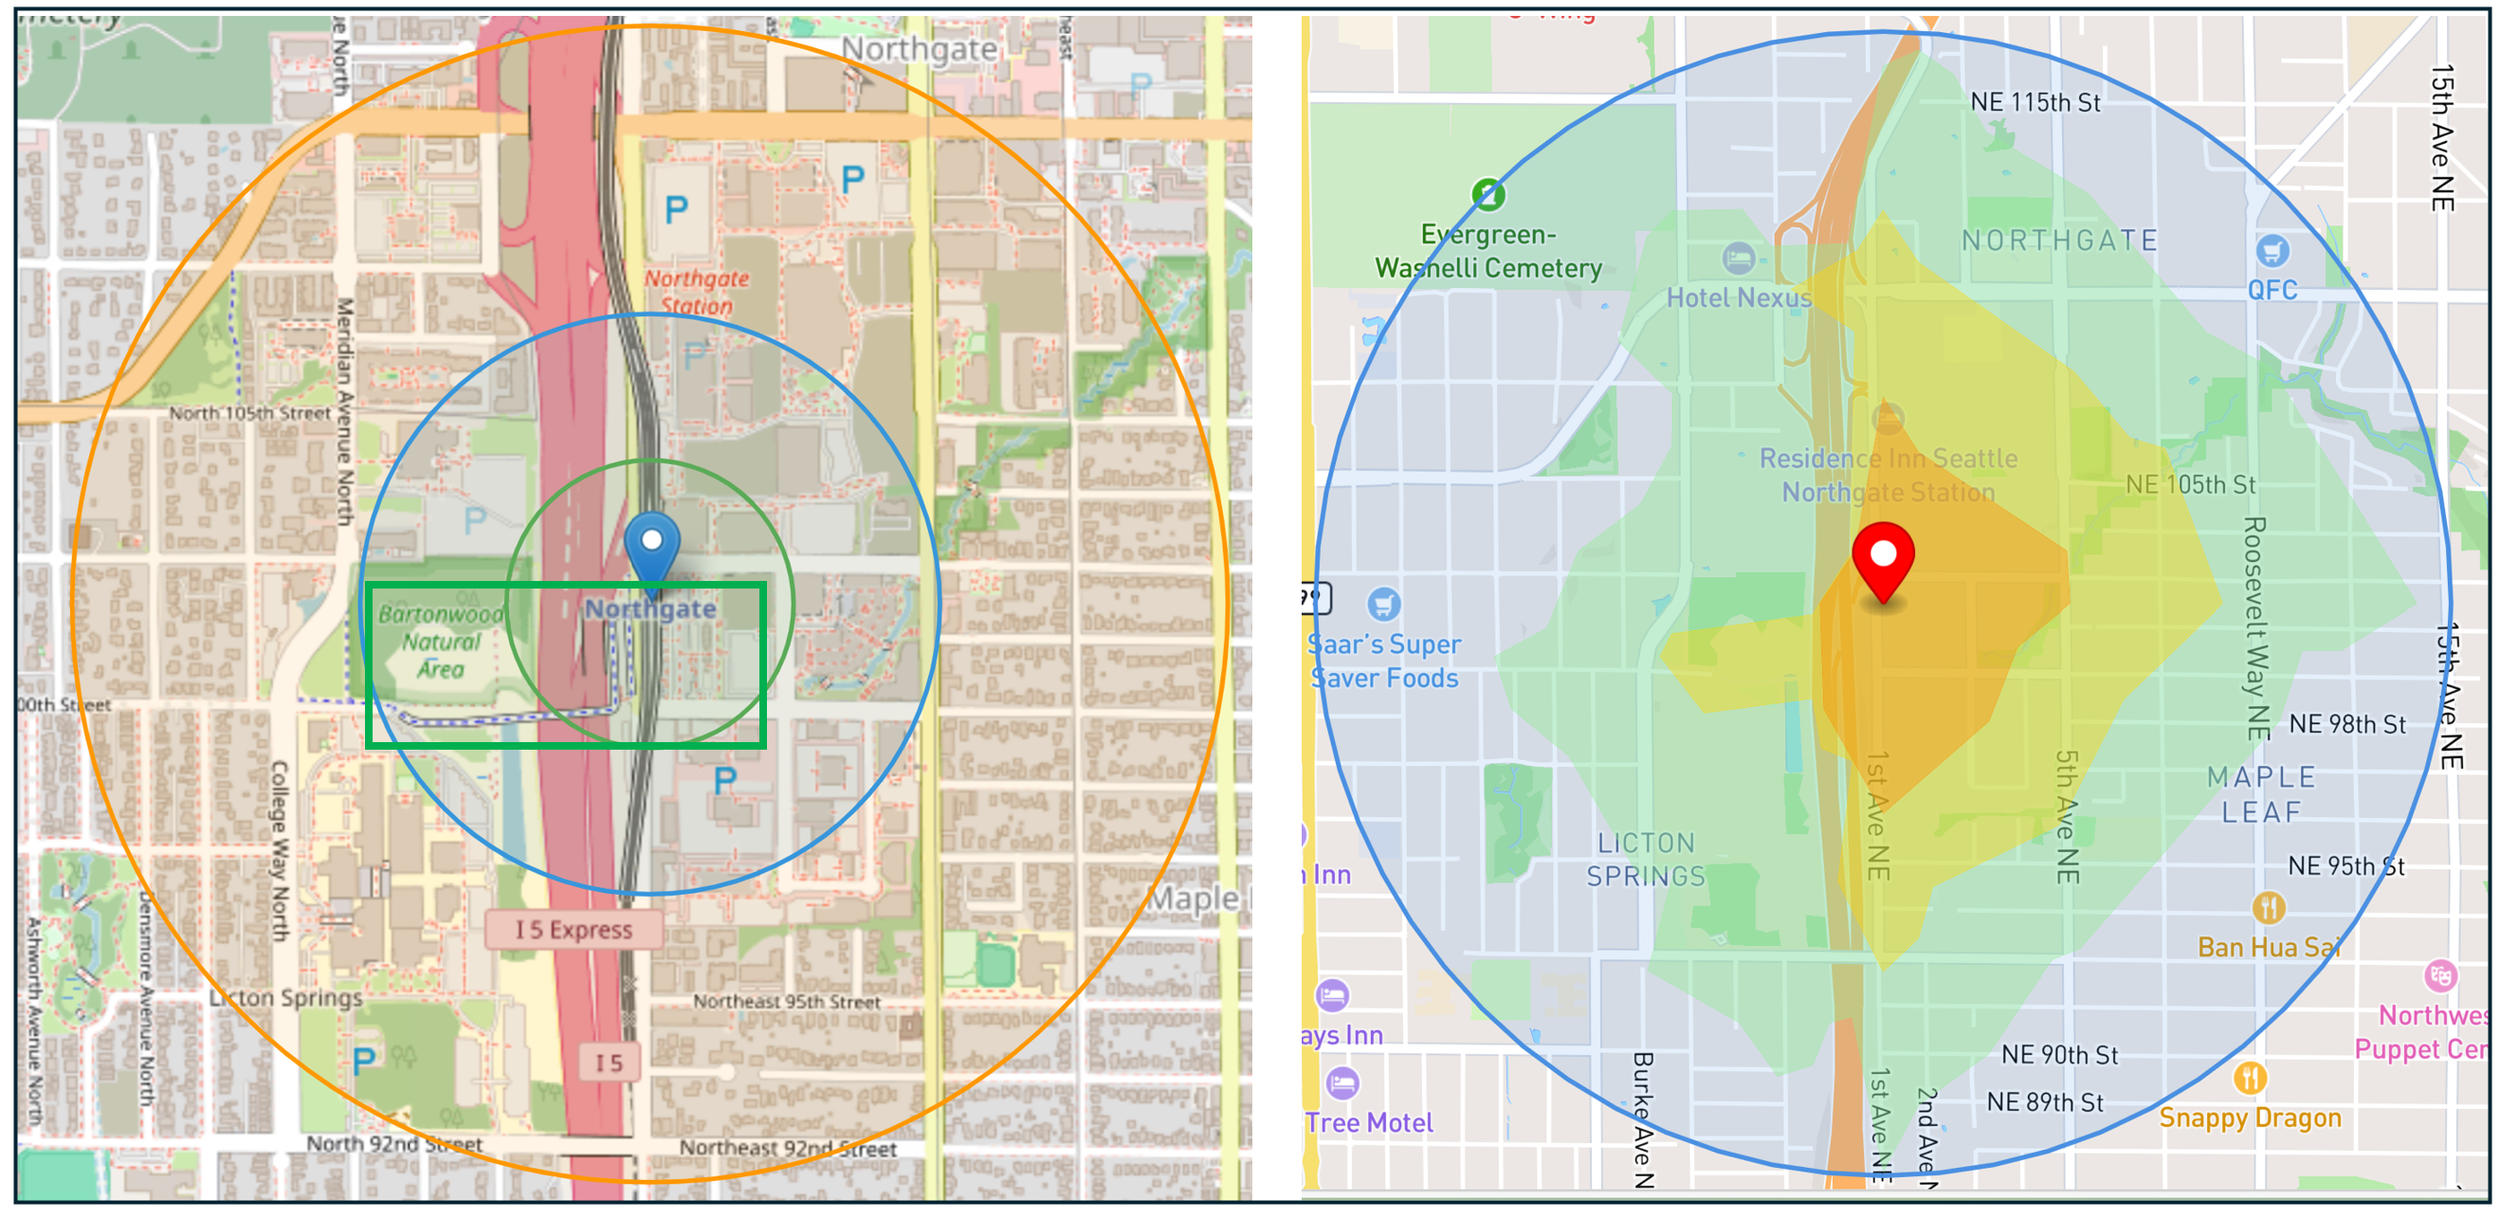
Left: A National Transit Station Atlas map of the Northgate station that highlights the John Lewis Bridge. Right: The walkshed map identifying that 0.92 square miles of land is available within a 15-minute walk, including large sections of land across the highway from the station.
Reclaiming Lost Space: Gotham Park
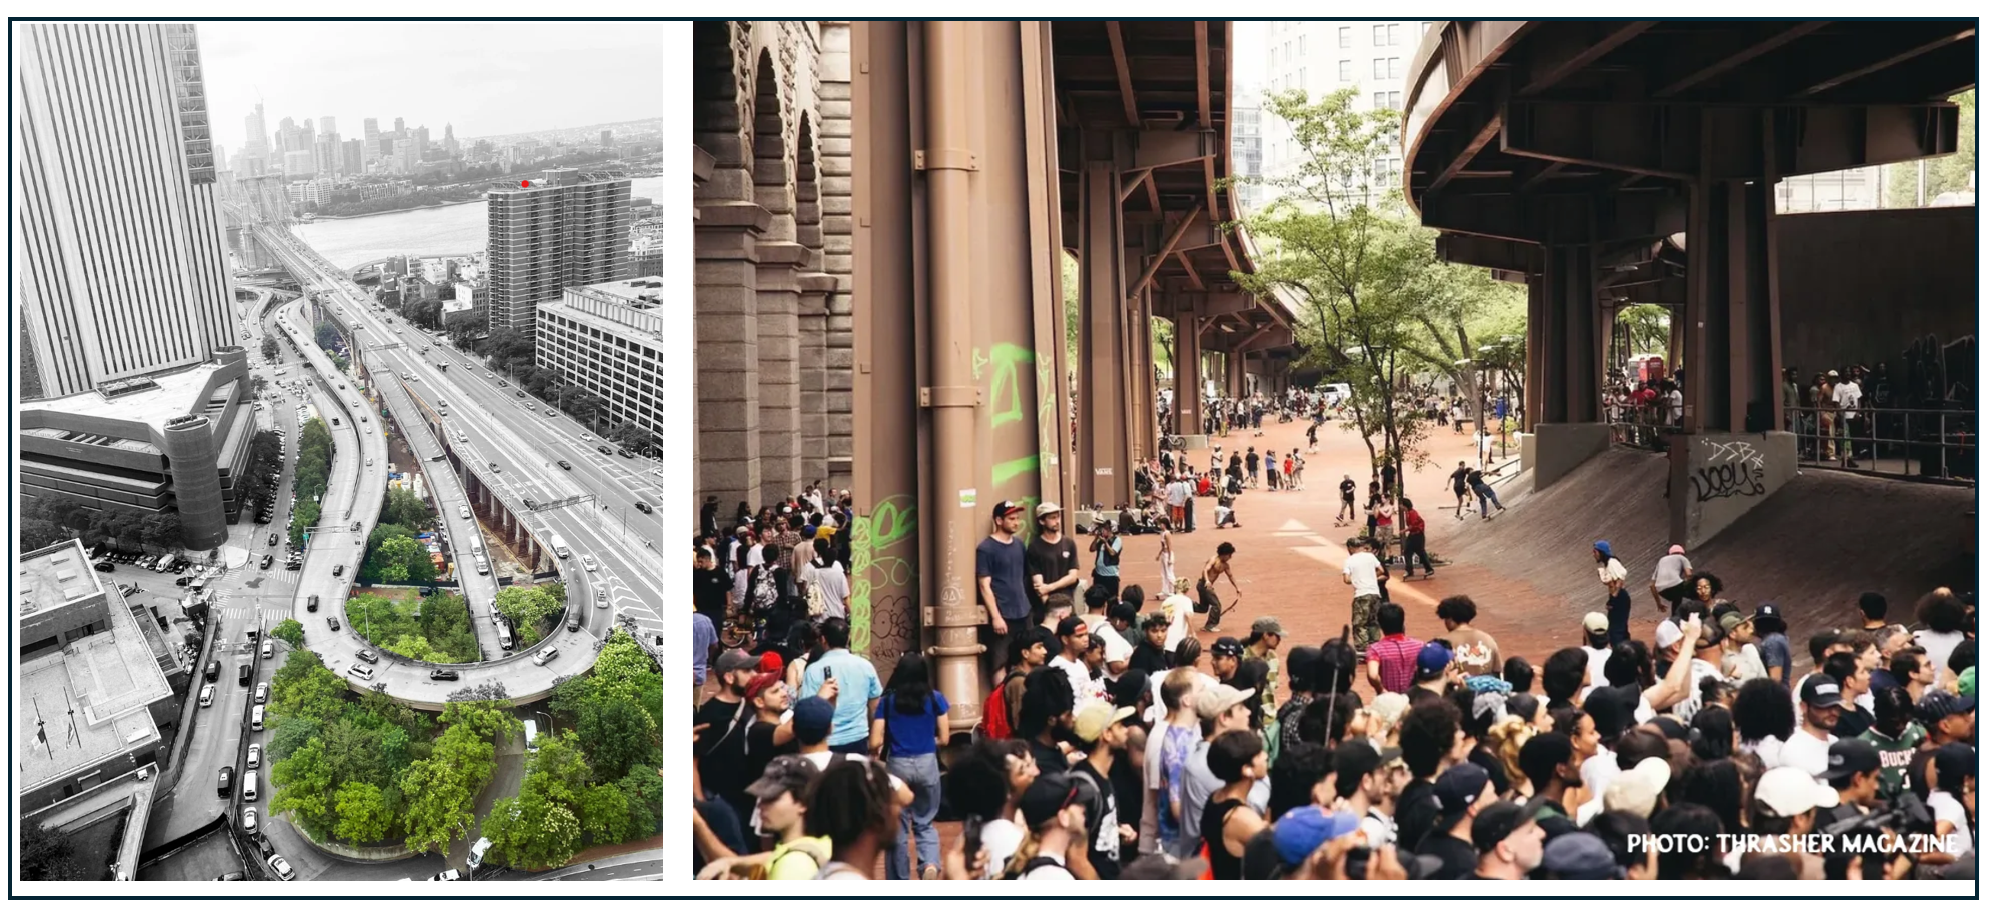
A rendering of Gotham Park (left) and the 2025 re-opening of the Brooklyn Banks skatepark, a portion of the overall vision for the park.
Background
Every case so far has involved a community confronting a highway that was actively doing harm: dividing neighborhoods, suppressing walksheds, poisoning air, erasing the street grid. Interventions seek to repair the damage: remove the freeway, bury it, cap it, bridge over it. The case of Gotham Park offers something different: improve neglected areas caused by highway construction while leaving the roads unchanged.
The Brooklyn Bridge is one of New York City’s most recognized landmarks, but precious few celebrate its west-side entrance. In 1953, the city approved a controversial rebuilding of the Manhattan entrance plaza. The project required demolishing 21 structures, including the old New York World Building, an relocating 410 families on Park Row. Approach ramps to the FDR Drive were added through the 1960s, Wikipedia expanding the highway infrastructure's footprint and encircling the space. For decades the land sat beneath the ramps and arches in a kind of infrastructural limbo — too complicated to develop, too exposed to feel safe, and eventually pressed into service as a contractor staging area for the bridge's multi-decade rehabilitation program. When the most intensive repair work wound down around 2020, the question of what to do with the land resurfaced.
Timeline
Advocates first came together at a Manhattan Community Board meeting in late 2020, when community members spoke about the importance and need for public space in this location, which had been closed to public access for over a decade. Gotham Park Brooklyn Bridge Manhattan Inc., doing business as Gotham Park, was formed in early 2021. Gotham Park What followed was remarkably fast by New York standards. After only two years of advocacy, the first acre of the envisioned nine-acre public space opened on May 24, 2023 — the 140th anniversary of the Brooklyn Bridge's opening. Gotham Park An additional 15,000 square feet opened on November 18, 2024, and three more acres were scheduled to open in early 2025. Gotham Park
The full nine-acre vision — stretching from City Hall to the East River — remains in development. Brooklyn Bridge repair work is ongoing, requiring that Gotham Park revert to public use in several stages Gotham Park as construction staging areas are vacated. The long-term timeline for the complete park, including the vaulted interior spaces of the bridge's Manhattan anchorage, has not been formally established.
Cost
The project has been built in financially distinct layers. The early phases — sports courts, skateboarding, benches, tree plantings — were relatively low-cost activations of space the city already owned, requiring minimal capital investment. Mayor Adams announced a $50 million city capital commitment in June 2025 Gotham Park to advance the next phases of the park. Gotham Park has asked the mayor to make a roughly $200 million city capital commitment to advance the full nine-acre vision. CityLand No comprehensive cost estimate for the complete build-out has been publicly released, and the phased nature of the project makes a single number difficult to establish.
Even at $200 million, the comparison to the rest of this series is instructive. The John Lewis Bridge cost $56 million to span a highway. The Rondo Land Bridge would cost $450 million to cap one. The Big Dig cost $24 billion to bury one. Gotham Park, at full build-out, would cost less than half the price of a pedestrian bridge because the land already exists, the infrastructure overhead is already built, and no highway is being moved or modified.
Funding
Funding has come from a patchwork of city capital dollars, federal grants, and private support. A $2 million federal Reconnecting Communities grant was awarded in early 2025 Congressman Daniel Goldman for community outreach, concept design, traffic analysis, and vault surveys for the next phase. The grant application framed the project explicitly around the program's equity mission: the Reconnecting Communities program seeks to undo the effects of outmoded urban planning "by removing, retrofitting, or mitigating highways or other transportation facilities that create barriers to community connectivity" — a description that tracks almost precisely to the origins of the land that is now evolving into Gotham Park. The Broadsheet The long-term capital program will depend on city bonding, additional federal competitive grants, and likely private philanthropy for programming and operations.
Challenges
The central structural challenge is the ongoing bridge rehabilitation itself. Brooklyn Bridge repair work is ongoing, requiring that Gotham Park reopen in stages Gotham Park as each section is cleared of construction equipment. This has produced the project's distinctive phased character — not a planned sequence of programmatic expansions, but an opportunistic reclamation of space as the DOT finishes using it.
The multi-agency complexity is also real. A project spanning multiple agencies, bureaucracies, stages, and hurdles requires the focus, time, and hard work of an enormous number of people behind the scenes, New York City as Gotham Park's president Rosa Chang noted at the November 2024 opening. NYC DOT controls the land; the Parks Department, EDC, NYPD, and the Mayor's Office of Climate and Environmental Justice all have overlapping interests. Securing a durable commitment to the nine-acre vision — rather than piecemeal activations that could be reversed when the next round of bridge work begins — is the organizational challenge that determines whether this becomes a permanent park or a temporary amenity.
Impacts and Public Reaction
The early phases have been enthusiastically received. The first section included a skateboard park and courts for basketball, shuffleboard, and pickleball The Broadsheet — the return of the legendary Brooklyn Banks skate spot, which had been closed for over a decade, generated particular community excitement. The November 2024 expansion added shade trees and seating. The park sits at the confluence of some of Manhattan's densest and most underserved neighborhoods: the area serves a community of over 47,000 residents on Lower Manhattan's East Side, bringing together Chinatown, Two Bridges, Little Italy, NYCHA's Alfred E. Smith Houses, and the Financial District. Congressman Daniel Goldman
The longer-term vision is striking. Plans call for converting the vaulted spaces inside the bridge's Manhattan anchorage into public use: a community hub, a New York Public Library branch, and a Brooklyn Bridge Museum. There is also a proposed Maker Space tied to the bridge's engineering history. Irvingyee That would transform the interior of the bridge's masonry anchorage — one of the great pieces of nineteenth-century civil engineering in America — into a neighborhood cultural institution, literally inhabiting the infrastructure rather than simply living beside it.
The transit connections are immediate: the Brooklyn Bridge-City Hall station (4/5/6 lines) sits directly adjacent, and the Fulton Street complex (A/C/J/M/Z lines) is a short walk away. For the 19,000 daily bridge pedestrians who currently land in a parking lot, the park also represents a qualitative transformation of what it means to arrive in Manhattan.
Transit Access: What the Data Shows
Here the Atlas data tells a different story than in any of the previous cases, and it is worth being direct about what that means. The Brooklyn Bridge-City Hall station on the 4, 5, and 6 lines sits directly adjacent to the park. The Fulton Street complex is a short walk away. The transit access is already excellent and the park does nothing to change it.
Unlike the Embarcadero and Big Dig, where freeway removal restored pedestrian connections across a severed corridor, or the John Lewis Bridge, where a new crossing expanded a station's walkshed by measurable degrees, Gotham Park removes no barriers and adds no new connections. The walkshed looks the same before and after. What changes is what the walkshed contains — for the 19,000 people who cross the Brooklyn Bridge on foot each day, the park transforms what it means to arrive. It does not make transit more accessible. It makes the neighborhood more worth arriving in.
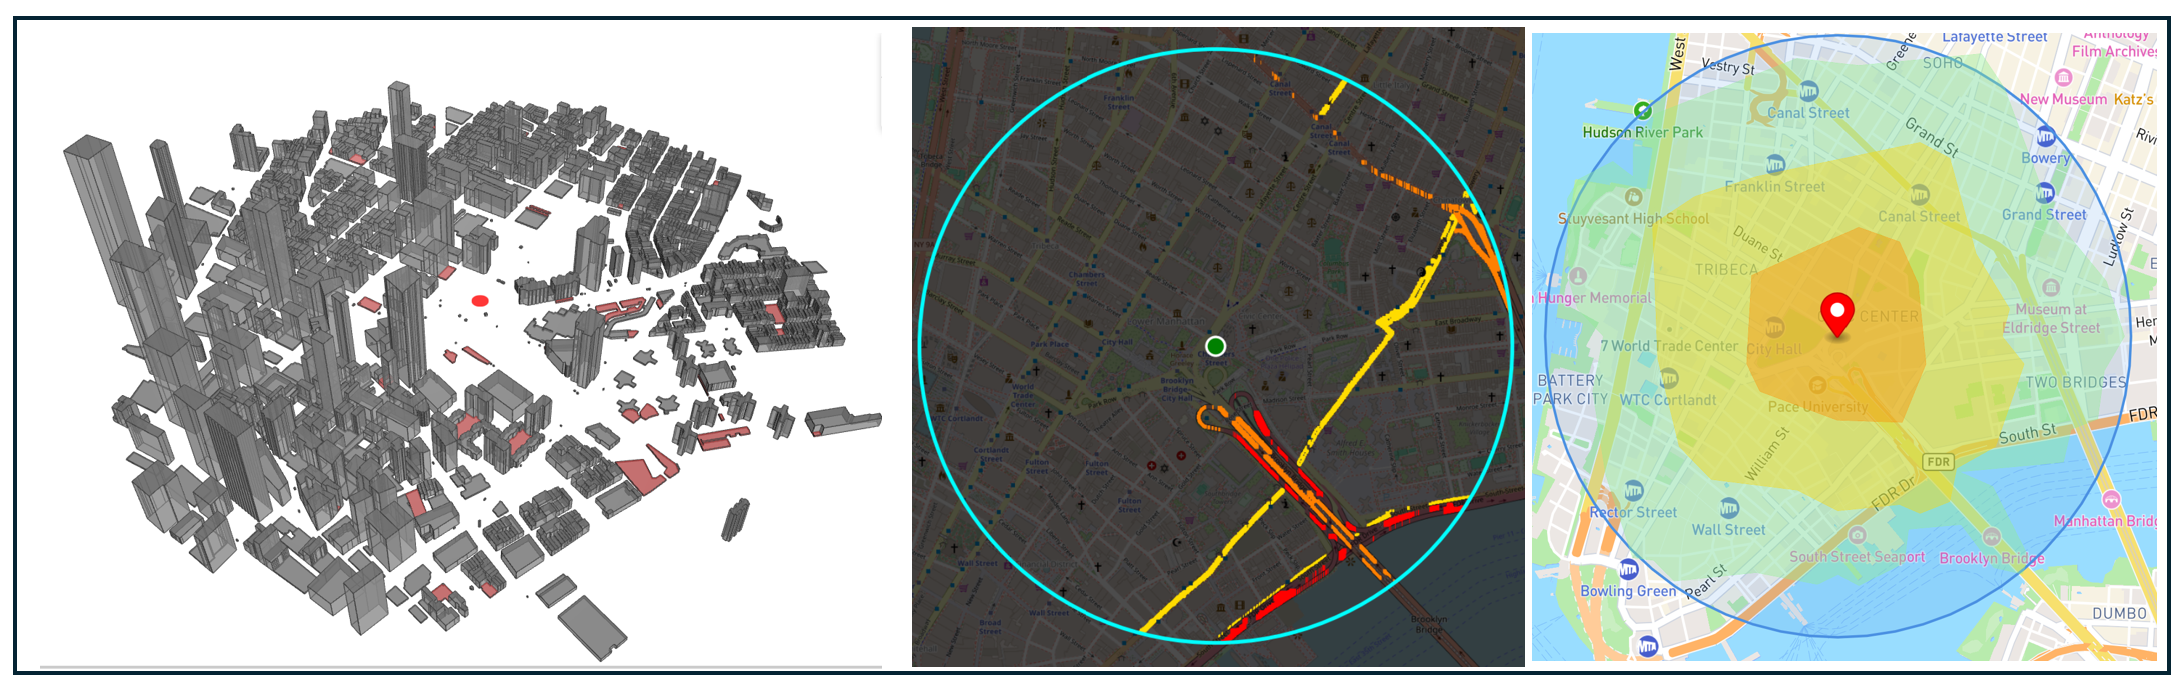
National Transit Atlas maps of the area around the Brooklyn Bridge/City Hall station showing building density, existing highways and arterial roads, and walksheds.
Adaptive Co-Existence: Wiehle-Reston East
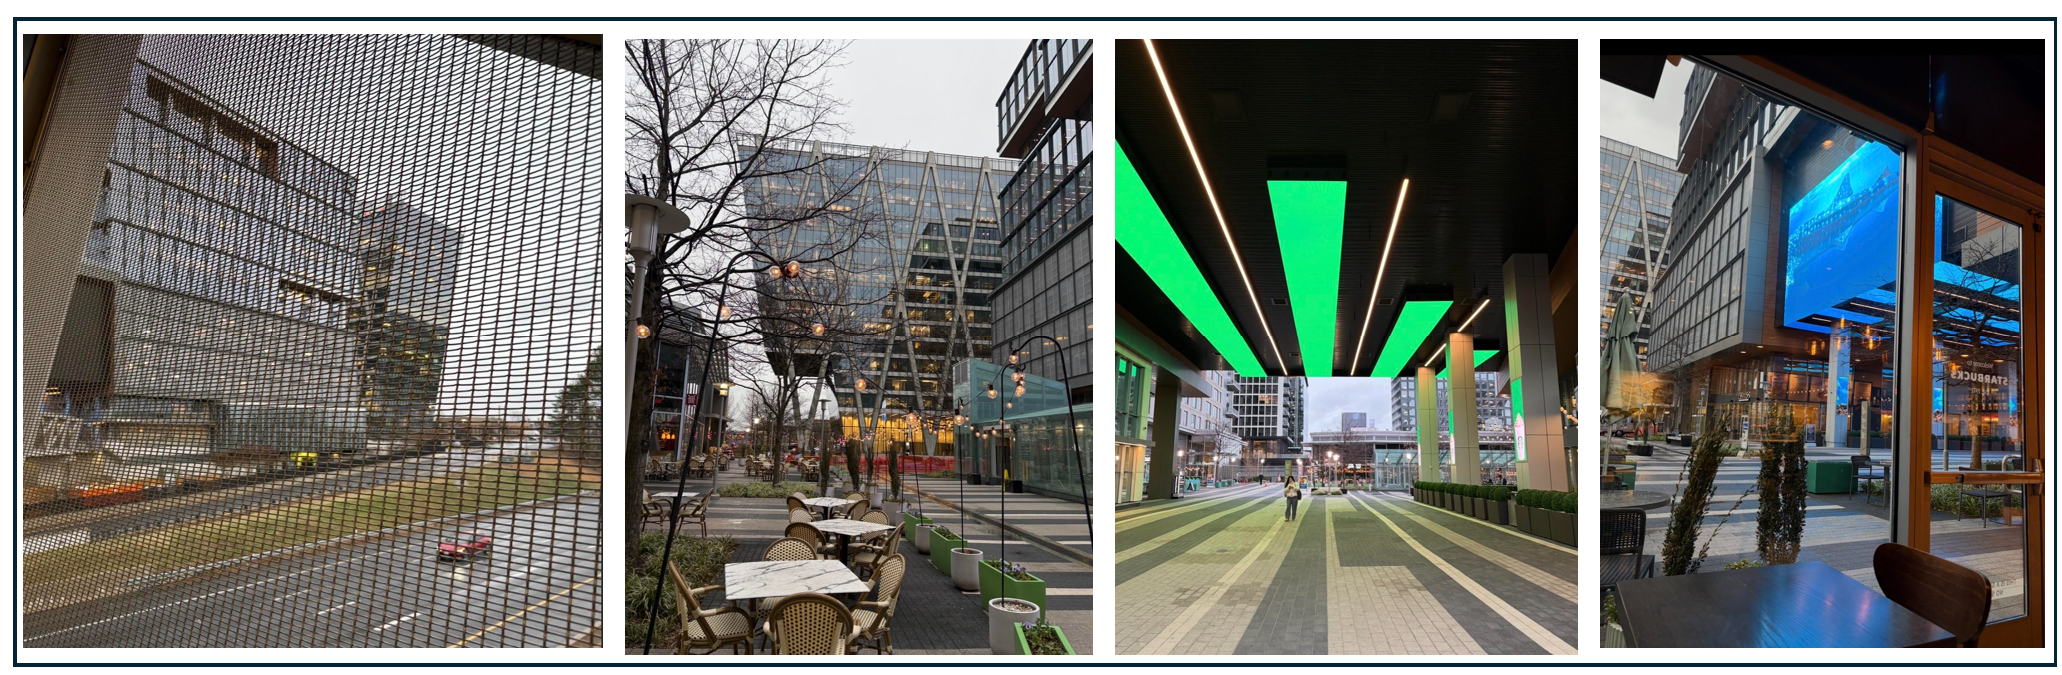
The Wiehle-Reston East development. Photos by the author.
Background
Every previous case in this series has treated the highway as something to remove, bury, cap, bridge, or at minimum reclaim space around. The transit-oriented development at Wiehle-Reston East on the WMATA Silver Line accepts the adjacent highway as given and does its best to live with it.
There would be no Silver Line without the Dulles Toll Road. For reasons Post 2 of this series examined in some detail, transit was built there because the right-of-way was available, the corridor served the same market as the road, and highway adjacency was the path of least resistance.
The site's previous life was a surface park-and-ride lot an endpoint built around the assumption that riders would drive the first leg of every trip. Fairfax County, recognizing that a surface parking lot was not the highest use of the land, awarded development rights to Comstock Partners.
Timeline
The deal between Fairfax County and Comstock was structured around the Silver Line construction schedule. The Station underground garage was delivered as part of Phase 1 of the Silver Line in July 2014, on the same day that Metro's Silver Line began service — and it is the only parking structure and transit-oriented development fully integrated with any of the Phase 1 expansion stations. Wikipedia Above-grade construction on the plaza began after the station opened. A second phase — the Reston Row District — received county approval in 2018, broke ground in 2021, and the first building in Reston Row opened in 2024. Wikipedia
Cost and Private Investment
The project included some public funding, such as $91.3 million for the underground garage of which Fairfax County paid $87 million. Patch. From there, the capital has been overwhelmingly private. The full Reston Station buildout represents billions in private development. For the Reston Row phase alone, Comstock paid more than $150 million for site acquisition in 2019 and 2020, Reston Now before a single shovel of construction. No single total construction figure has been disclosed across all phases, but the completed and planned program — more than five million square feet of completed and planned buildings spanning both sides of the Dulles Toll Road Comstock Companies — represents private investment in the range of $2–3 billion.
Funding
The public contribution was the garage and the land rights. Everything else — office towers, residences, hotel, retail, public plaza — was privately financed by Comstock through a combination of equity, debt, and lease pre-commitments. The model is deliberately self-reinforcing: early office tenants like Google anchored the project's credibility, which enabled financing for residential and hospitality phases, which in turn made the neighborhood attractive enough to recruit additional tenants. Corporate tenants including Google, ICF Global, Neustar, Spotify, Qualtrics, and Rolls-Royce of North America have relocated their headquarters to Reston Station. Comstockpartnerslc The Silver Line itself — a $6.8 billion public investment Comstockpartnerslc — is of course the indispensable precondition, but that cost belongs to the transit project, not the TOD.
Challenges
The project's central tension is physical, not financial. The development consists of a subterranean Metro parking facility beneath a public plaza surrounded by office and residential high-rise buildings, Wikipedia and vertical transportation through the garage and the bus level leads visitors to the Reston Station Plaza, which connects directly to the pedestrian overpass by which passengers cross the westbound lanes of the Dulles Toll Road to enter the Metro station situated in the highway median. Wikipedia Read that sentence carefully: to reach the train, you take an elevator from a subterranean garage, cross a plaza, and then walk a pedestrian bridge over active highway lanes. The highway is not invisible. The south side of the development faces the same problem in reverse — the station entrance exits onto a ramp interchange, and Wiehle Avenue spans eleven lanes of combined highway and access road traffic. Comstock's Phase 2 plans explicitly aim to create "at-grade pedestrian pathways to the Metro Station" as an improvement over what exists today.
The equity dimension also bears mention. Reston Station will be the first residential development located along the Dulles Toll Road, Patch and what it delivers is luxury product. The program includes approximately 900 luxury residences, more than 500,000 square feet of Class A office space, a 200-plus room hotel, Wikipedia and a JW Marriott with luxury condominiums. This is not workforce housing. The community benefits are real — transit access, jobs, tax base — but they flow primarily to high-income residents and corporate tenants, not to the kind of displaced communities at the center of the Rondo or Mandela Parkway stories.
Impacts and My Visit
By conventional TOD metrics, Reston Station is a success. The development has transformed a surface parking lot into an urban neighborhood with residents, workers, restaurants, and a functioning street grid. Public reaction has been broadly positive, with the usual suburban concerns about traffic and density at the margins.
I took the Silver Line from downtown DC to Wiehle-Reston East on a raw morning in March. The final leg of the trip from the Spring Hill Station to the east took longer than between the previous stops as Wiehle Reston is spaced further out on the line. After traveling the Dulles access road for what seemed like more than five minutes, I could see the development looming like an enormous silver trapezoid or a Noah’s Ark. I exited the station, crossed the covered bridge over the highway and stepped through a neon lit passageway into a pleasant courtyard with restaurants, tables, and grass surrounded by glass and steel. A soulful John Mayer tune played through the speakers, presumably to create a mood. The highway was out of sight, but not out of earshot, as the whoosh and rumble of cars and trucks mingled with the piped in music.
That sensory experience is, I think, the most honest possible summary of what adaptive co-existence delivers: something genuinely pleasant, carefully designed to make the best of a condition it has no intention of changing. The wall is still there. It has been tastefully decorated.
Which Path Is Yours?
Six cities. Six interventions. A spectrum running from a $24 billion hole in the ground to a park assembled one cleared acre at a time. For each project to be successful, the people and organizations leading them need to match their ambitions to local circumstances. Organizers of freeway removal in West Oakland and San Francisco were able to accomplish something grand because an earthquake forced the question, the community organized to demand something better than a rebuild, and Caltrans had no politically viable alternative. On the other hand, Seattle did not build a pedestrian bridge because a pedestrian bridge was the most transformative thing imaginable. It built one because the Northgate Link was coming, the timeline was fixed, and a bridge was what the moment and the budget could support. The right intervention is always the one that fits the actual situation.
Based on the conclusions of my three part series, and lessons from the case studies in particular, I’ve drafted a series of questions for planners, advocates, and community members trying to find their path forward.
1. What does the data actually show? Before choosing an intervention, diagnose the physical problem. How much of the station's walkable catchment is consumed by highway infrastructure? How close is the highway to the platform? How severely is the walkshed compressed? The Atlas data can help answer some of these questions, and the answers determine which interventions are even physically on the table. A highway at the edge of the catchment circle is a different problem than a highway in the median.
2. Did the highway come before or after the transit station and does that change what's owed? The relationship between highways and transit stations was shaped by who arrived first. But the cases add a moral dimension to that historical question. West Oakland and Rondo are asking for restitution for what was taken. On the other hand, Wiehle Reston East is optimizing an arrangement that was never experienced as harm. Understanding which of these situations yours most resembles shapes not just the intervention but the argument you make for it.
3. Do you have a window of opportunity? The cases suggest that the origin of a project shapes everything downstream. An earthquake, an engineering failure, a parallel transit expansion, a contractor staging area clearing out — each creates a different kind of opening with different political dynamics and funding possibilities. A community choosing to act without a forcing event faces a harder path and should plan accordingly.
4. What is the intervention actually for and how will you know if it worked? Reconnecting a divided community, righting a historical wrong, spurring economic development, making a transit investment accessible, and reclaiming forgotten space are different (though not mutually exclusive) objectives that point toward different solutions and demand different measures of success. The Atlas data is useful for answering specific questions about walksheds and barriers, but several cases in this series are doing something it can only partially measure. Rondo is an act of restorative justice. Gotham Park is a claim on forgotten civic space. Wiehle Reston East is an economic development strategy. Know which problem you are actually solving, choose your measures of success accordingly, and be honest about what your data can and cannot tell you.
5. Who needs to be at the table? Every successful project in this series required assembling a coalition that cut across agencies, jurisdictions, and interests that don't naturally work together. The John Lewis Bridge needed SDOT, Sound Transit, WSDOT, and King County Metro to all say yes. Rondo needs MnDOT, Ramsey County, the city of St. Paul, federal grant programs, and private developers to move on compatible timelines. The Embarcadero needed the city to hold its nerve against Caltrans. In almost every case, the decisive variable was whether the right people came together. Before committing to an intervention, map the coalition it requires and ask honestly whether you can build it. If the agencies that control the land, the funding, and the adjacent infrastructure aren't yet aligned, that misalignment is the first problem to solve, not the last.
6. Who bears the cost and who captures the benefit? In each case, public investment has attracted private capital, but who captures that value varies enormously. Rondo and West Oakland are trying to ensure the community that paid the original cost in displacement captures the benefit of reclamation. Wiehle Reston East delivered the benefit primarily to luxury residents and corporate tenants. The intervention you can afford may not be the intervention that serves justice.
7. What can you realistically spend, and where will it come from? The spectrum runs from $11.5 million to $24 billion. Each funding model in the cases — federal disaster relief, highway mitigation agreements, transit levies, private development rights, Reconnecting Communities grants — came with specific preconditions that may or may not exist in your situation. And as Rondo illustrates, a funding strategy built on discretionary federal programs is only as durable as the political environment that sustains them.
8. Is there an adjacent project you can couple with? The John Lewis Bridge's seven-year timeline was only possible because it was tightly coupled to the Northgate Link expansion. The Wiehle Reston East development was structured around the Silver Line construction schedule from day one. Rondo's timeline has slipped in part because it depends on MnDOT's separate Rethinking I-94 process moving on a compatible schedule. A standalone highway mitigation project competes for attention, funding, and political will against everything else on the public agenda. An intervention attached to a transit expansion, a highway reconstruction, or a major redevelopment effort inherits momentum it didn't have to generate itself.
9. How long can your community sustain the effort? Seven years for the John Lewis Bridge. Sixteen for Mandela Parkway. Forty for the Embarcadero if you count from opening day. Speed correlates with two things: a forcing event and tight coupling to an adjacent project. A community without either should ask honestly whether it has the organizational capacity to maintain a coalition across a decade or more, and if not, whether a smaller, faster intervention might deliver more than a larger, slower one that never gets built.
10. What happens to the people already there if the intervention succeeds? West Oakland got cleaner air and rising displacement pressure simultaneously. Rondo is trying to get ahead of that dynamic through community ownership structures, but the outcome is unresolved. The Embarcadero produced a 300% increase in property values in a city already struggling with affordability. Success, in every removal and reclamation case in this series, has generated pressure on the communities it was meant to serve. An intervention without an anti-displacement strategy may be the beginning of different problems down the road.
Rethinking Mobility
After spending the morning at Wiehle-Reston East, I traveled back to the city on the Silver Line, staring out the window at the miles of the Dulles Access Road alongside the tracks. Infrastructure may not exist in its current state forever, but it’s not hard to imagine the Interstate Highway System in some form joining the pyramids or China’s Great Wall as a project whose footprint lasts for millennia. The highway system is a testament to the primacy of mobility, our society’s desire to move people from “point A” to “point B” in as little time as possible. There’s nothing necessarily wrong with reaching destinations quickly (I am not abandoning Interstate 95 travel for a trip up Route 1 any time soon). But I also wish we could prioritize and accelerate economic and social mobility and sustainable transportation needed in our warming world. The pyramids were built for the dead. The Interstate Highway System was built for drivers. The question these six cities are beginning to answer is what we might build, finally, for everyone else.